Zip Codes with the Highest Percentage of Population with a Degree in Physical and Health Sciences in Eureka, CA
RELATED REPORTS & OPTIONS
Physical and Health Sciences
Eureka
Compare Zip Codes
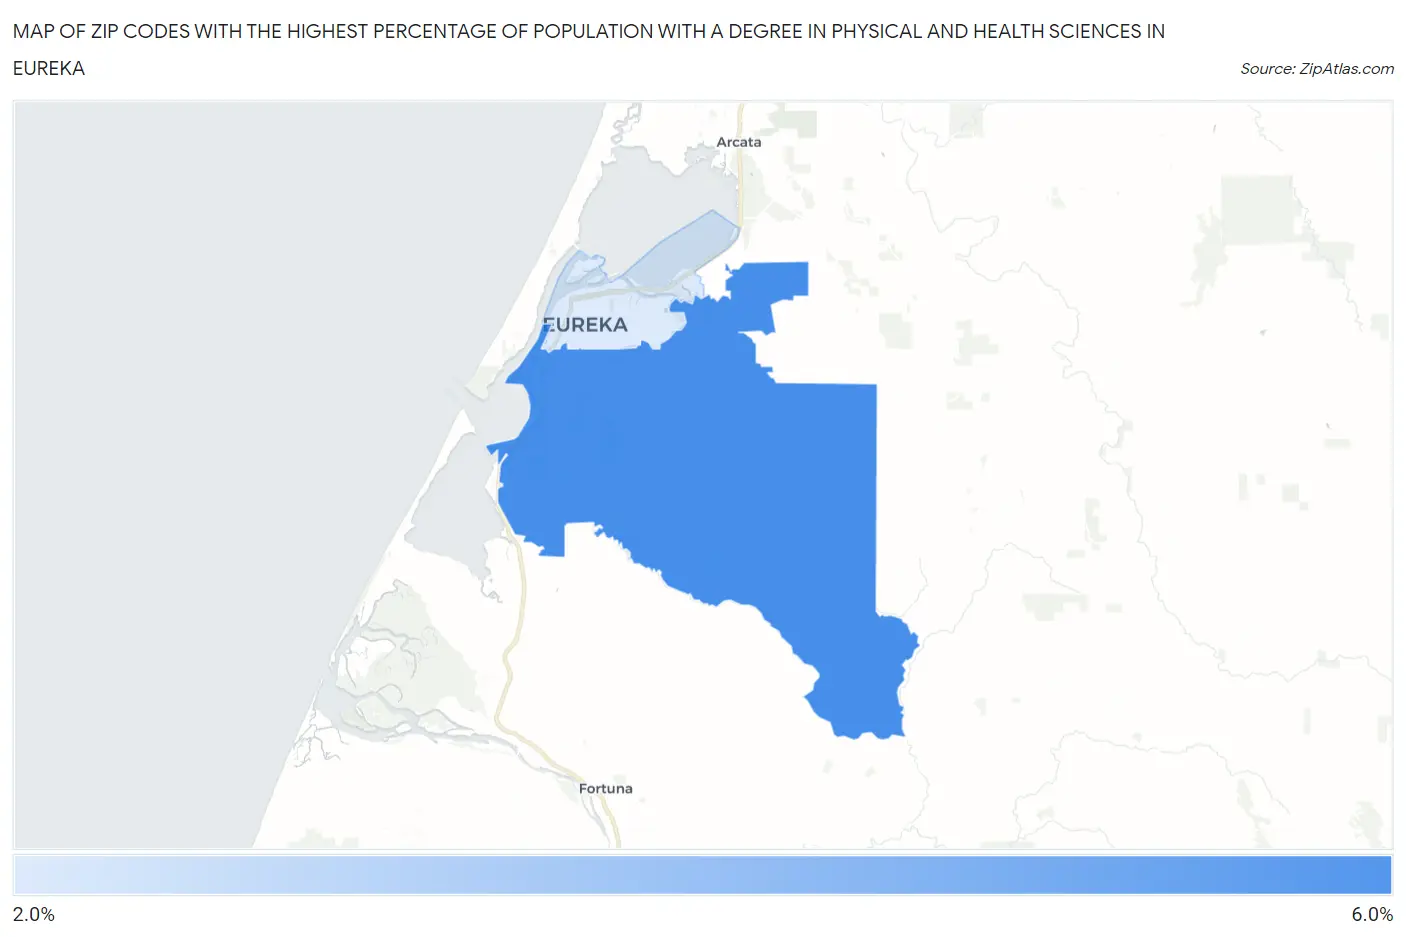
Map of Zip Codes with the Highest Percentage of Population with a Degree in Physical and Health Sciences in Eureka
0.0%
6.0%
Zip Codes with the Highest Percentage of Population with a Degree in Physical and Health Sciences in Eureka, CA
| Zip Code | % Graduates | vs State | vs National | |
| 1. | 95503 | 5.4% | 3.1%(+2.31)#197 | 3.1%(+2.33)#3,915 |
| 2. | 95501 | 2.7% | 3.1%(-0.389)#728 | 3.1%(-0.374)#11,655 |
1
Common Questions
What are the Top Zip Codes with the Highest Percentage of Population with a Degree in Physical and Health Sciences in Eureka, CA?
Top Zip Codes with the Highest Percentage of Population with a Degree in Physical and Health Sciences in Eureka, CA are:
What zip code has the Highest Percentage of Population with a Degree in Physical and Health Sciences in Eureka, CA?
95503 has the Highest Percentage of Population with a Degree in Physical and Health Sciences in Eureka, CA with 5.4%.
What is the Percentage of Population with a Degree in Physical and Health Sciences in Eureka, CA?
Percentage of Population with a Degree in Physical and Health Sciences in Eureka is 3.4%.
What is the Percentage of Population with a Degree in Physical and Health Sciences in California?
Percentage of Population with a Degree in Physical and Health Sciences in California is 3.1%.
What is the Percentage of Population with a Degree in Physical and Health Sciences in the United States?
Percentage of Population with a Degree in Physical and Health Sciences in the United States is 3.1%.