Zip Codes with the Highest Percentage of Population Employed in Arts, Media & Entertainment in Eureka, CA
RELATED REPORTS & OPTIONS
Arts, Media & Entertainment
Eureka
Compare Zip Codes
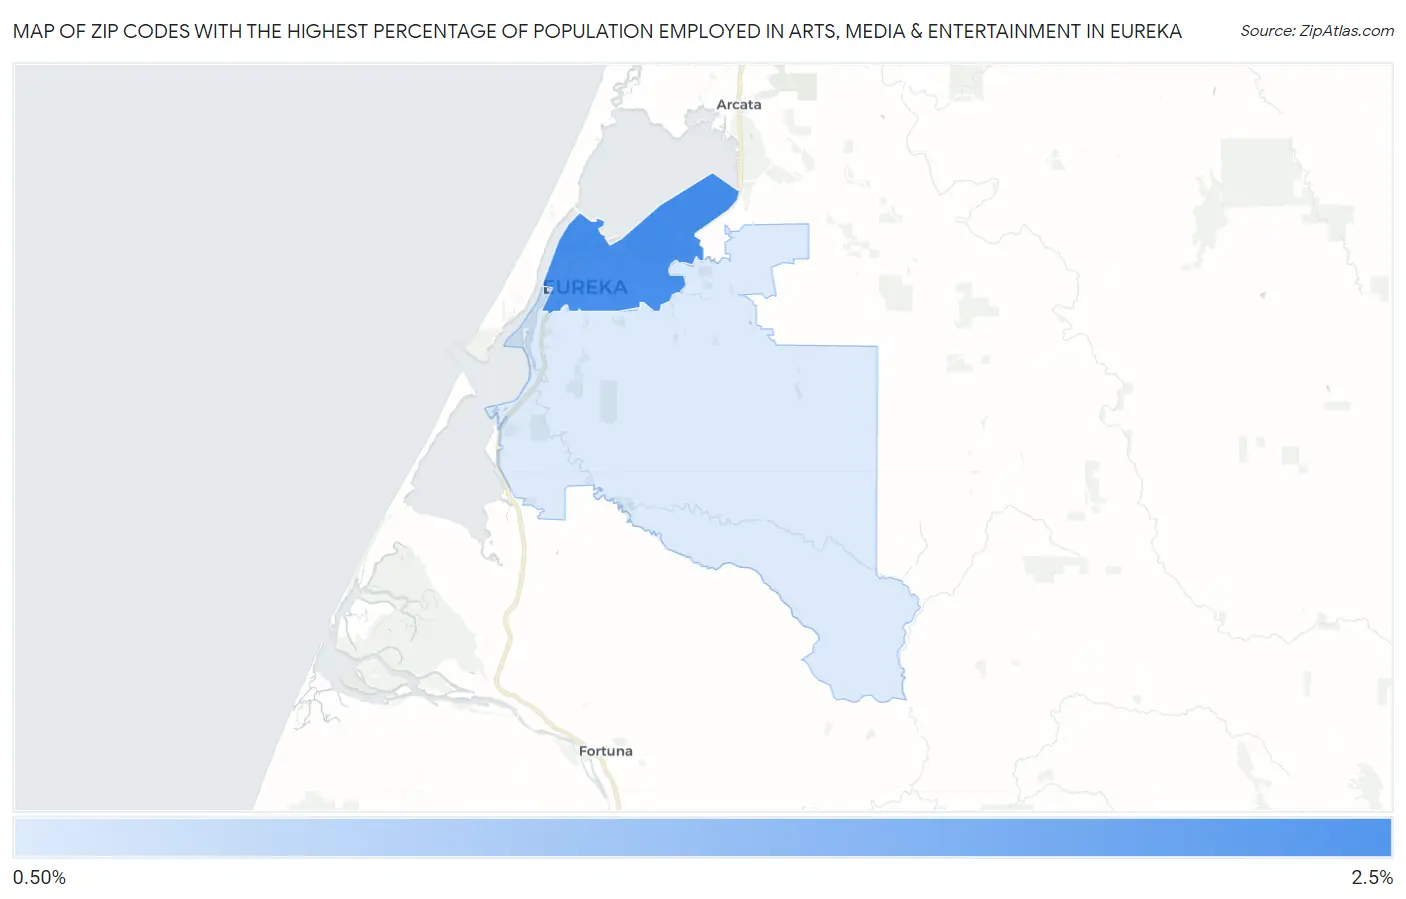
Map of Zip Codes with the Highest Percentage of Population Employed in Arts, Media & Entertainment in Eureka
0.0%
2.5%
Zip Codes with the Highest Percentage of Population Employed in Arts, Media & Entertainment in Eureka, CA
| Zip Code | % Employed | vs State | vs National | |
| 1. | 95501 | 2.2% | 3.0%(-0.739)#673 | 2.1%(+0.165)#6,700 |
| 2. | 95503 | 1.00% | 3.0%(-1.97)#1,143 | 2.1%(-1.07)#14,844 |
1
Common Questions
What are the Top Zip Codes with the Highest Percentage of Population Employed in Arts, Media & Entertainment in Eureka, CA?
Top Zip Codes with the Highest Percentage of Population Employed in Arts, Media & Entertainment in Eureka, CA are:
What zip code has the Highest Percentage of Population Employed in Arts, Media & Entertainment in Eureka, CA?
95501 has the Highest Percentage of Population Employed in Arts, Media & Entertainment in Eureka, CA with 2.2%.
What is the Percentage of Population Employed in Arts, Media & Entertainment in Eureka, CA?
Percentage of Population Employed in Arts, Media & Entertainment in Eureka is 2.0%.
What is the Percentage of Population Employed in Arts, Media & Entertainment in California?
Percentage of Population Employed in Arts, Media & Entertainment in California is 3.0%.
What is the Percentage of Population Employed in Arts, Media & Entertainment in the United States?
Percentage of Population Employed in Arts, Media & Entertainment in the United States is 2.1%.