Zip Codes with the Highest Percentage of Population with a Degree in Science and Engineering in Chino, CA
RELATED REPORTS & OPTIONS
Science and Engineering
Chino
Compare Zip Codes
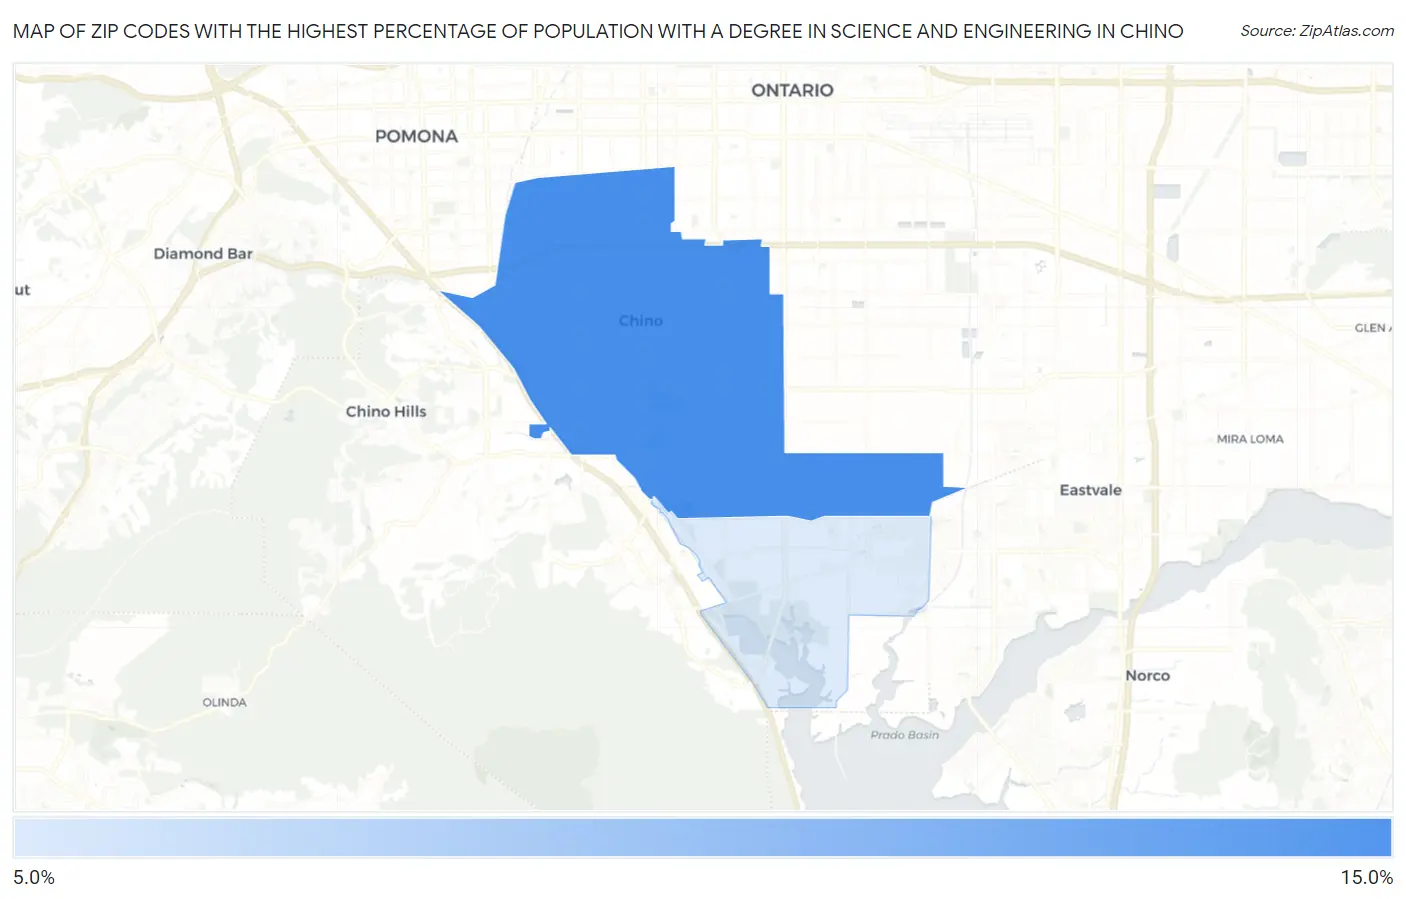
Map of Zip Codes with the Highest Percentage of Population with a Degree in Science and Engineering in Chino
0.0%
15.0%
Zip Codes with the Highest Percentage of Population with a Degree in Science and Engineering in Chino, CA
| Zip Code | % Graduates | vs State | vs National | |
| 1. | 91710 | 10.8% | 8.3%(+2.57)#375 | 9.8%(+1.05)#13,230 |
| 2. | 91708 | 10.0% | 8.3%(+1.77)#472 | 9.8%(+0.252)#14,950 |
1
Common Questions
What are the Top Zip Codes with the Highest Percentage of Population with a Degree in Science and Engineering in Chino, CA?
Top Zip Codes with the Highest Percentage of Population with a Degree in Science and Engineering in Chino, CA are:
What zip code has the Highest Percentage of Population with a Degree in Science and Engineering in Chino, CA?
91710 has the Highest Percentage of Population with a Degree in Science and Engineering in Chino, CA with 10.8%.
What is the Percentage of Population with a Degree in Science and Engineering in Chino, CA?
Percentage of Population with a Degree in Science and Engineering in Chino is 10.4%.
What is the Percentage of Population with a Degree in Science and Engineering in California?
Percentage of Population with a Degree in Science and Engineering in California is 8.3%.
What is the Percentage of Population with a Degree in Science and Engineering in the United States?
Percentage of Population with a Degree in Science and Engineering in the United States is 9.8%.