Zip Codes with the Highest Percentage of Population Employed in Food Preparation & Serving in Yakima, WA
RELATED REPORTS & OPTIONS
Food Preparation & Serving
Yakima
Compare Zip Codes
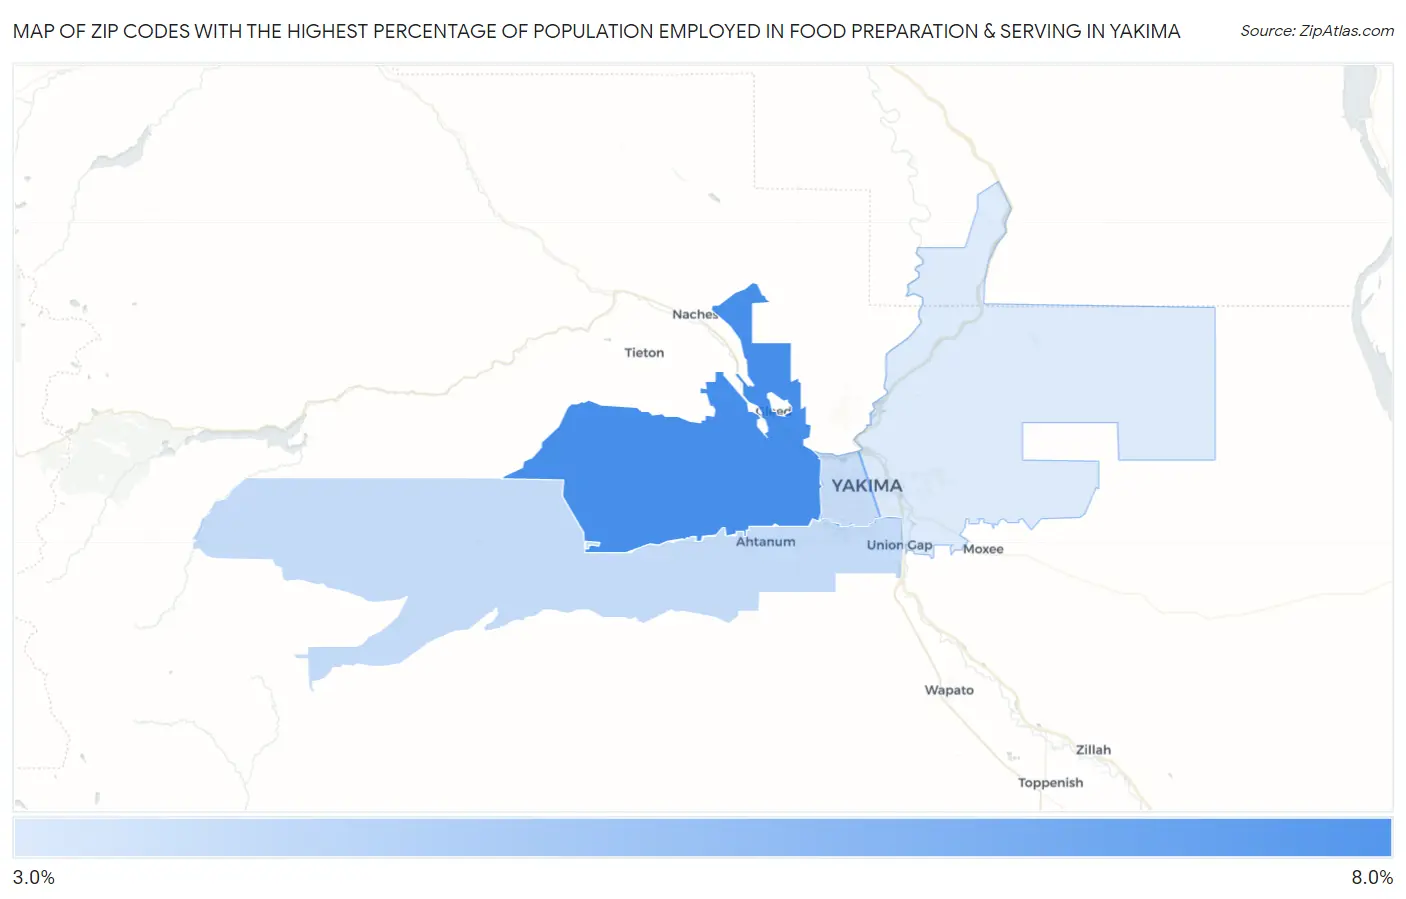
Map of Zip Codes with the Highest Percentage of Population Employed in Food Preparation & Serving in Yakima
0.0%
8.0%
Zip Codes with the Highest Percentage of Population Employed in Food Preparation & Serving in Yakima, WA
| Zip Code | % Employed | vs State | vs National | |
| 1. | 98908 | 7.5% | 5.1%(+2.35)#94 | 5.3%(+2.21)#5,569 |
| 2. | 98903 | 4.5% | 5.1%(-0.686)#281 | 5.3%(-0.829)#15,181 |
| 3. | 98902 | 4.4% | 5.1%(-0.790)#290 | 5.3%(-0.933)#15,631 |
| 4. | 98901 | 3.9% | 5.1%(-1.27)#328 | 5.3%(-1.42)#17,668 |
1
Common Questions
What are the Top 3 Zip Codes with the Highest Percentage of Population Employed in Food Preparation & Serving in Yakima, WA?
Top 3 Zip Codes with the Highest Percentage of Population Employed in Food Preparation & Serving in Yakima, WA are:
What zip code has the Highest Percentage of Population Employed in Food Preparation & Serving in Yakima, WA?
98908 has the Highest Percentage of Population Employed in Food Preparation & Serving in Yakima, WA with 7.5%.
What is the Percentage of Population Employed in Food Preparation & Serving in Yakima, WA?
Percentage of Population Employed in Food Preparation & Serving in Yakima is 5.5%.
What is the Percentage of Population Employed in Food Preparation & Serving in Washington?
Percentage of Population Employed in Food Preparation & Serving in Washington is 5.1%.
What is the Percentage of Population Employed in Food Preparation & Serving in the United States?
Percentage of Population Employed in Food Preparation & Serving in the United States is 5.3%.