Zip Codes with the Highest Percentage of Population Employed in Professional & Scientific Services in Seattle, WA
RELATED REPORTS & OPTIONS
Professional & Scientific Services
Seattle
Compare Zip Codes
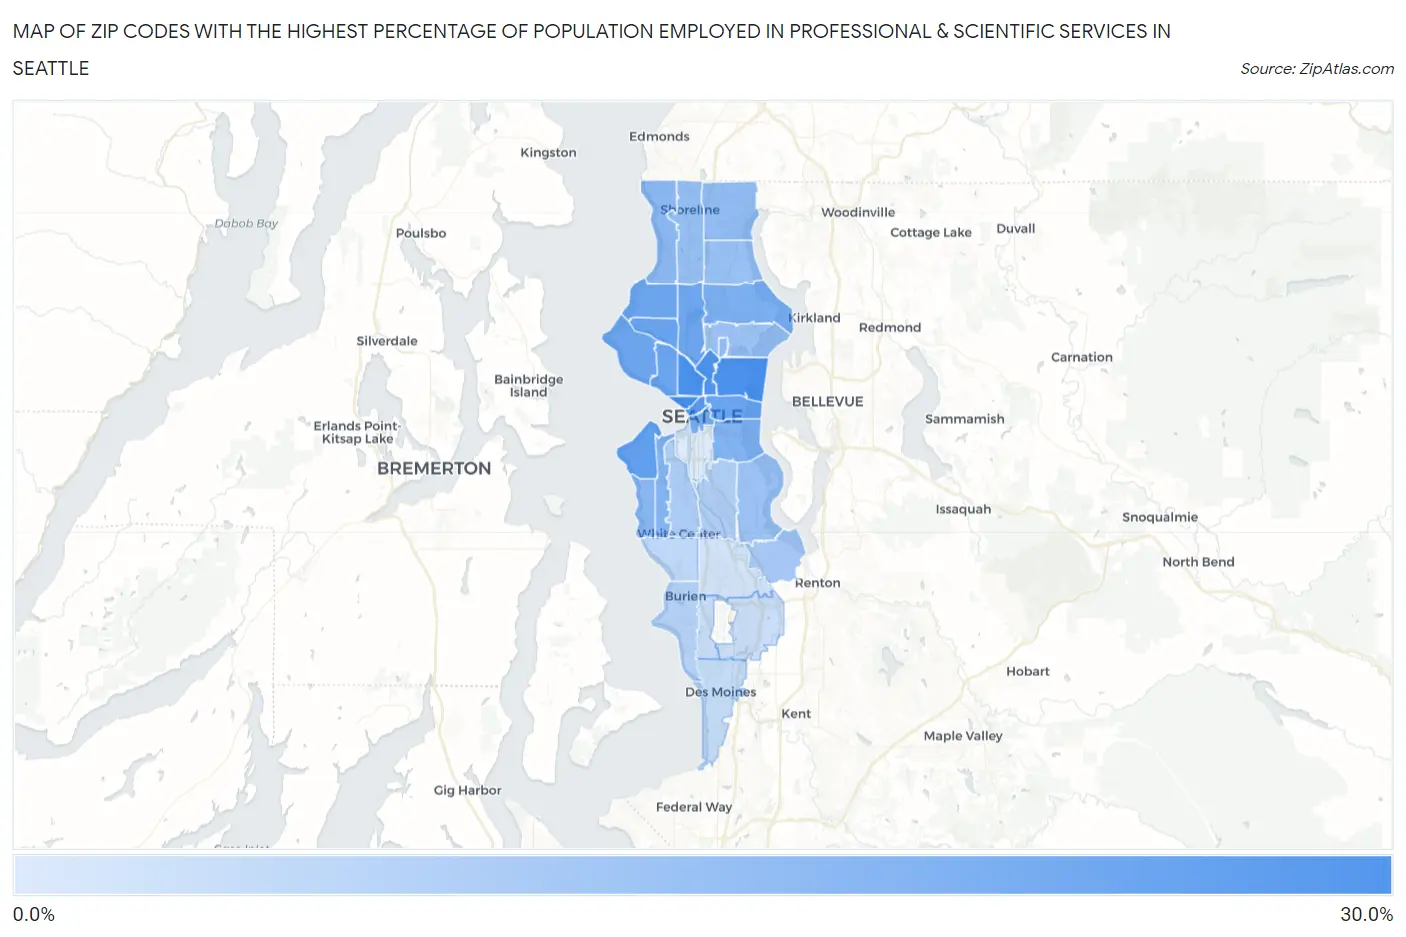
Map of Zip Codes with the Highest Percentage of Population Employed in Professional & Scientific Services in Seattle
0.0%
30.0%
Zip Codes with the Highest Percentage of Population Employed in Professional & Scientific Services in Seattle, WA
| Zip Code | % Employed | vs State | vs National | |
| 1. | 98121 | 29.2% | 10.3%(+18.9)#8 | 7.8%(+21.4)#244 |
| 2. | 98112 | 28.4% | 10.3%(+18.1)#10 | 7.8%(+20.5)#277 |
| 3. | 98109 | 28.2% | 10.3%(+17.9)#11 | 7.8%(+20.3)#283 |
| 4. | 98102 | 27.8% | 10.3%(+17.5)#13 | 7.8%(+19.9)#299 |
| 5. | 98101 | 26.1% | 10.3%(+15.7)#16 | 7.8%(+18.2)#369 |
| 6. | 98116 | 24.0% | 10.3%(+13.6)#21 | 7.8%(+16.1)#507 |
| 7. | 98122 | 23.0% | 10.3%(+12.7)#24 | 7.8%(+15.1)#577 |
| 8. | 98107 | 22.9% | 10.3%(+12.6)#26 | 7.8%(+15.1)#583 |
| 9. | 98119 | 22.4% | 10.3%(+12.1)#27 | 7.8%(+14.6)#630 |
| 10. | 98117 | 22.1% | 10.3%(+11.8)#29 | 7.8%(+14.3)#652 |
| 11. | 98199 | 22.1% | 10.3%(+11.7)#30 | 7.8%(+14.2)#657 |
| 12. | 98103 | 22.0% | 10.3%(+11.6)#31 | 7.8%(+14.1)#667 |
| 13. | 98104 | 20.3% | 10.3%(+9.95)#36 | 7.8%(+12.4)#855 |
| 14. | 98115 | 19.5% | 10.3%(+9.14)#39 | 7.8%(+11.6)#955 |
| 15. | 98144 | 18.7% | 10.3%(+8.37)#41 | 7.8%(+10.9)#1,042 |
| 16. | 98126 | 18.2% | 10.3%(+7.87)#43 | 7.8%(+10.3)#1,125 |
| 17. | 98136 | 16.9% | 10.3%(+6.60)#51 | 7.8%(+9.09)#1,377 |
| 18. | 98177 | 16.7% | 10.3%(+6.34)#53 | 7.8%(+8.82)#1,436 |
| 19. | 98195 | 16.4% | 10.3%(+6.08)#54 | 7.8%(+8.57)#1,515 |
| 20. | 98155 | 16.1% | 10.3%(+5.74)#57 | 7.8%(+8.22)#1,593 |
| 21. | 98133 | 15.1% | 10.3%(+4.78)#58 | 7.8%(+7.26)#1,865 |
| 22. | 98125 | 14.6% | 10.3%(+4.30)#62 | 7.8%(+6.79)#2,036 |
| 23. | 98118 | 14.3% | 10.3%(+4.00)#63 | 7.8%(+6.48)#2,146 |
| 24. | 98105 | 14.3% | 10.3%(+3.98)#64 | 7.8%(+6.46)#2,154 |
| 25. | 98178 | 12.6% | 10.3%(+2.25)#77 | 7.8%(+4.73)#2,903 |
| 26. | 98164 | 12.2% | 10.3%(+1.85)#81 | 7.8%(+4.34)#3,097 |
| 27. | 98106 | 11.1% | 10.3%(+0.785)#92 | 7.8%(+3.27)#3,752 |
| 28. | 98108 | 11.1% | 10.3%(+0.762)#94 | 7.8%(+3.25)#3,786 |
| 29. | 98166 | 9.9% | 10.3%(-0.426)#109 | 7.8%(+2.06)#4,655 |
| 30. | 98146 | 8.3% | 10.3%(-1.98)#153 | 7.8%(+0.500)#6,216 |
| 31. | 98198 | 7.1% | 10.3%(-3.25)#196 | 7.8%(-0.767)#8,031 |
| 32. | 98148 | 7.0% | 10.3%(-3.31)#198 | 7.8%(-0.831)#8,147 |
| 33. | 98188 | 6.3% | 10.3%(-4.01)#225 | 7.8%(-1.53)#9,355 |
| 34. | 98168 | 5.3% | 10.3%(-5.06)#286 | 7.8%(-2.58)#11,634 |
| 35. | 98134 | 3.6% | 10.3%(-6.69)#376 | 7.8%(-4.21)#16,235 |
1
Common Questions
What are the Top 10 Zip Codes with the Highest Percentage of Population Employed in Professional & Scientific Services in Seattle, WA?
Top 10 Zip Codes with the Highest Percentage of Population Employed in Professional & Scientific Services in Seattle, WA are:
What zip code has the Highest Percentage of Population Employed in Professional & Scientific Services in Seattle, WA?
98121 has the Highest Percentage of Population Employed in Professional & Scientific Services in Seattle, WA with 29.2%.
What is the Percentage of Population Employed in Professional & Scientific Services in Seattle, WA?
Percentage of Population Employed in Professional & Scientific Services in Seattle is 20.5%.
What is the Percentage of Population Employed in Professional & Scientific Services in Washington?
Percentage of Population Employed in Professional & Scientific Services in Washington is 10.3%.
What is the Percentage of Population Employed in Professional & Scientific Services in the United States?
Percentage of Population Employed in Professional & Scientific Services in the United States is 7.8%.