Zip Codes with the Highest Percentage of Population Employed in Sales & Related in Seattle, WA
RELATED REPORTS & OPTIONS
Sales & Related
Seattle
Compare Zip Codes
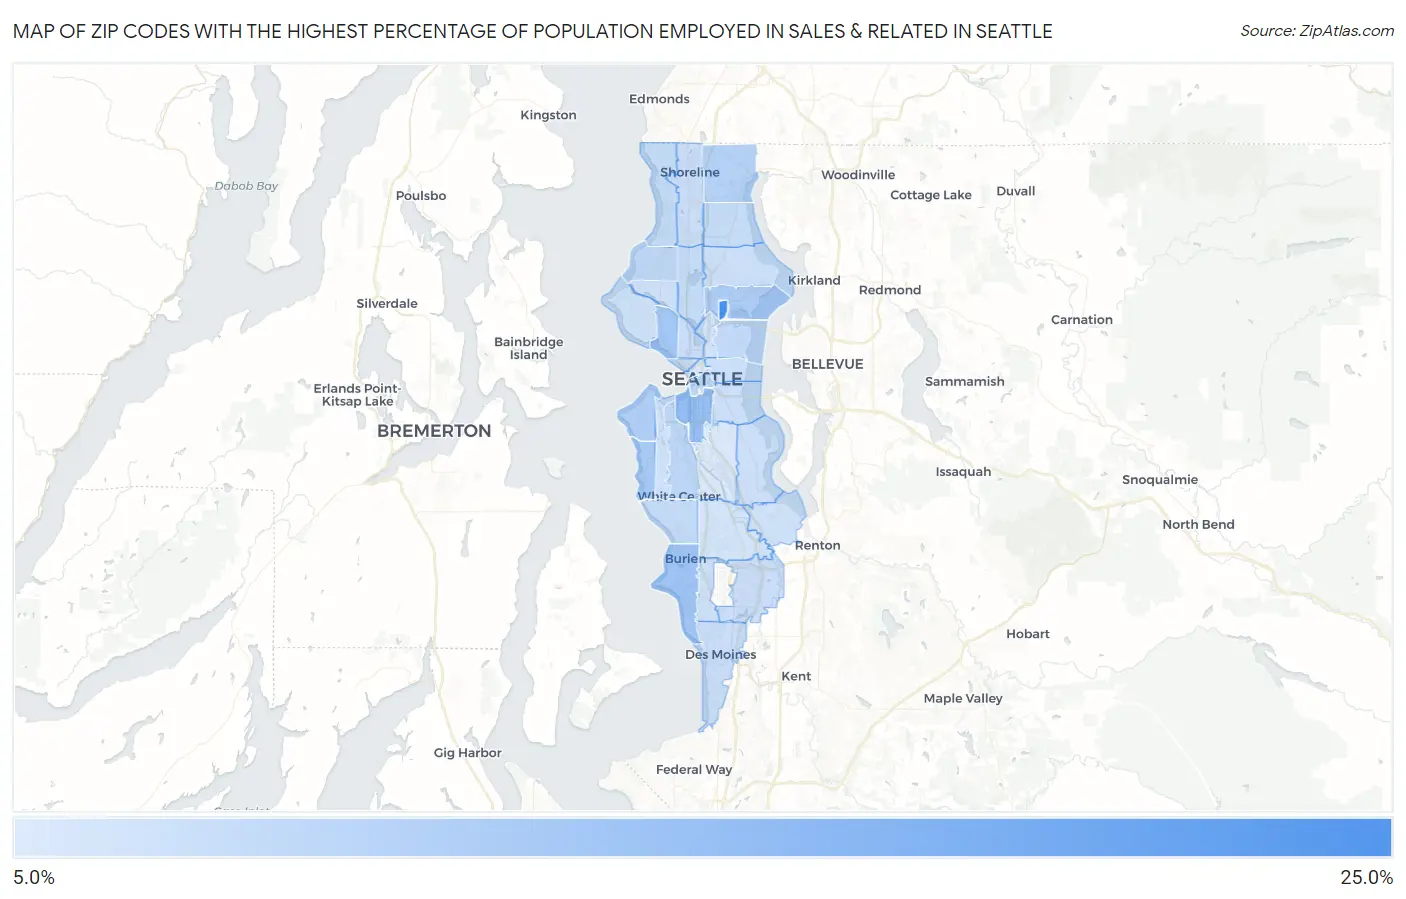
Map of Zip Codes with the Highest Percentage of Population Employed in Sales & Related in Seattle
0.0%
25.0%
Zip Codes with the Highest Percentage of Population Employed in Sales & Related in Seattle, WA
| Zip Code | % Employed | vs State | vs National | |
| 1. | 98195 | 22.0% | 8.8%(+13.2)#13 | 9.6%(+12.4)#898 |
| 2. | 98134 | 12.9% | 8.8%(+4.12)#61 | 9.6%(+3.32)#4,585 |
| 3. | 98166 | 11.5% | 8.8%(+2.71)#97 | 9.6%(+1.90)#7,010 |
| 4. | 98119 | 11.2% | 8.8%(+2.41)#114 | 9.6%(+1.61)#7,679 |
| 5. | 98136 | 10.8% | 8.8%(+1.96)#133 | 9.6%(+1.16)#8,843 |
| 6. | 98105 | 10.3% | 8.8%(+1.51)#155 | 9.6%(+0.702)#10,120 |
| 7. | 98116 | 9.9% | 8.8%(+1.10)#176 | 9.6%(+0.296)#11,351 |
| 8. | 98155 | 9.3% | 8.8%(+0.488)#226 | 9.6%(-0.315)#13,496 |
| 9. | 98106 | 8.5% | 8.8%(-0.262)#274 | 9.6%(-1.07)#16,246 |
| 10. | 98104 | 8.3% | 8.8%(-0.540)#295 | 9.6%(-1.34)#17,235 |
| 11. | 98117 | 8.2% | 8.8%(-0.632)#298 | 9.6%(-1.43)#17,549 |
| 12. | 98112 | 8.0% | 8.8%(-0.793)#305 | 9.6%(-1.60)#18,064 |
| 13. | 98146 | 7.7% | 8.8%(-1.11)#325 | 9.6%(-1.92)#19,079 |
| 14. | 98125 | 7.5% | 8.8%(-1.27)#337 | 9.6%(-2.08)#19,598 |
| 15. | 98177 | 7.5% | 8.8%(-1.28)#338 | 9.6%(-2.08)#19,616 |
| 16. | 98103 | 7.5% | 8.8%(-1.33)#340 | 9.6%(-2.14)#19,796 |
| 17. | 98109 | 7.1% | 8.8%(-1.66)#357 | 9.6%(-2.46)#20,829 |
| 18. | 98188 | 7.1% | 8.8%(-1.68)#358 | 9.6%(-2.49)#20,889 |
| 19. | 98133 | 6.9% | 8.8%(-1.89)#371 | 9.6%(-2.69)#21,478 |
| 20. | 98198 | 6.9% | 8.8%(-1.91)#372 | 9.6%(-2.72)#21,529 |
| 21. | 98115 | 6.8% | 8.8%(-1.97)#375 | 9.6%(-2.77)#21,660 |
| 22. | 98118 | 6.8% | 8.8%(-2.03)#379 | 9.6%(-2.84)#21,833 |
| 23. | 98144 | 6.8% | 8.8%(-2.04)#380 | 9.6%(-2.84)#21,849 |
| 24. | 98122 | 6.7% | 8.8%(-2.10)#385 | 9.6%(-2.90)#21,975 |
| 25. | 98178 | 6.5% | 8.8%(-2.26)#394 | 9.6%(-3.06)#22,353 |
| 26. | 98199 | 6.5% | 8.8%(-2.27)#395 | 9.6%(-3.07)#22,380 |
| 27. | 98107 | 6.5% | 8.8%(-2.28)#397 | 9.6%(-3.09)#22,417 |
| 28. | 98148 | 6.5% | 8.8%(-2.33)#399 | 9.6%(-3.14)#22,543 |
| 29. | 98126 | 6.5% | 8.8%(-2.34)#401 | 9.6%(-3.14)#22,573 |
| 30. | 98121 | 6.4% | 8.8%(-2.37)#403 | 9.6%(-3.18)#22,644 |
| 31. | 98102 | 6.4% | 8.8%(-2.41)#406 | 9.6%(-3.21)#22,760 |
| 32. | 98168 | 6.1% | 8.8%(-2.66)#414 | 9.6%(-3.47)#23,368 |
| 33. | 98108 | 5.3% | 8.8%(-3.48)#440 | 9.6%(-4.28)#25,025 |
| 34. | 98101 | 5.0% | 8.8%(-3.74)#447 | 9.6%(-4.55)#25,482 |
1
Common Questions
What are the Top 10 Zip Codes with the Highest Percentage of Population Employed in Sales & Related in Seattle, WA?
Top 10 Zip Codes with the Highest Percentage of Population Employed in Sales & Related in Seattle, WA are:
What zip code has the Highest Percentage of Population Employed in Sales & Related in Seattle, WA?
98195 has the Highest Percentage of Population Employed in Sales & Related in Seattle, WA with 22.0%.
What is the Percentage of Population Employed in Sales & Related in Seattle, WA?
Percentage of Population Employed in Sales & Related in Seattle is 7.5%.
What is the Percentage of Population Employed in Sales & Related in Washington?
Percentage of Population Employed in Sales & Related in Washington is 8.8%.
What is the Percentage of Population Employed in Sales & Related in the United States?
Percentage of Population Employed in Sales & Related in the United States is 9.6%.