Zip Codes with the Highest Percentage of Families with Income Below $10,000 in Seattle, WA

RELATED REPORTS & OPTIONS

Family Income | $0-10k
Population
Families and Households
Female Fertility
Female Fertility (Unmarried)
Race (Community Size)
Race (Percentage)
Ancestry (Community Size)
AfghanAfricanAlaska NativeAlaskan AthabascanAlbanianAleutAmericanApacheArabArgentineanArmenianAssyrian / Chaldean / SyriacAustralianAustrianBahamianBangladeshiBarbadianBasqueBelgianBelizeanBhutaneseBlackfeetBolivianBrazilianBritishBritish West IndianBulgarianBurmeseCajunCambodianCanadianCape VerdeanCarpatho RusynCelticCentral AmericanCentral American IndianCherokeeCheyenneChickasawChileanChineseChippewaChoctawColombianColvilleComancheCosta RicanCreeCreekCroatianCrowCubanCypriotCzechCzechoslovakianDanishDelawareDominicanDutchEastern EuropeanEcuadorianEgyptianEnglishEstonianEthiopianEuropeanFijianFilipinoFinnishFrenchFrench American IndianFrench CanadianGermanGerman RussianGhanaianGreekGuamanian / ChamorroGuatemalanGuyaneseHaitianHonduranHopiHungarianIcelanderIndian (Asian)IndonesianInupiatIranianIraqiIrishIroquoisIsraeliItalianJamaicanJapaneseJordanianKenyanKoreanLaotianLatvianLebaneseLithuanianLuxembourgerMacedonianMalaysianMalteseMarshalleseMexicanMexican American IndianMongolianMoroccanNative HawaiianNavajoNepaleseNew ZealanderNicaraguanNigerianNorthern EuropeanNorwegianOkinawanOsagePakistaniPalestinianPanamanianParaguayanPennsylvania GermanPeruvianPolishPortuguesePotawatomiPuebloPuerto RicanPuget Sound SalishRomanianRussianSalvadoranSamoanScandinavianScotch-IrishScottishSeminoleSenegaleseSerbianShoshoneSiouxSlavicSlovakSloveneSomaliSouth AfricanSouth AmericanSouth American IndianSpaniardSpanishSpanish AmericanSri LankanSubsaharan AfricanSudaneseSwedishSwissSyrianThaiTlingit-HaidaTonganTrinidadian and TobagonianTsimshianTurkishUgandanUkrainianUruguayanUteVenezuelanVietnameseWelshWest IndianYakamaYaquiYugoslavianYup'ik
Ancestry (Percentage)
AfghanAfricanAlaska NativeAlaskan AthabascanAlbanianAleutAmericanApacheArabArgentineanArmenianAssyrian / Chaldean / SyriacAustralianAustrianBahamianBangladeshiBarbadianBasqueBelgianBelizeanBhutaneseBlackfeetBolivianBrazilianBritishBritish West IndianBulgarianBurmeseCajunCambodianCanadianCape VerdeanCarpatho RusynCelticCentral AmericanCentral American IndianCherokeeCheyenneChickasawChileanChineseChippewaChoctawColombianColvilleComancheCosta RicanCreeCreekCroatianCrowCubanCypriotCzechCzechoslovakianDanishDelawareDominicanDutchEastern EuropeanEcuadorianEgyptianEnglishEstonianEthiopianEuropeanFijianFilipinoFinnishFrenchFrench American IndianFrench CanadianGermanGerman RussianGhanaianGreekGuamanian / ChamorroGuatemalanGuyaneseHaitianHonduranHopiHungarianIcelanderIndian (Asian)IndonesianInupiatIranianIraqiIrishIroquoisIsraeliItalianJamaicanJapaneseJordanianKenyanKoreanLaotianLatvianLebaneseLithuanianLuxembourgerMacedonianMalaysianMalteseMarshalleseMexicanMexican American IndianMongolianMoroccanNative HawaiianNavajoNepaleseNew ZealanderNicaraguanNigerianNorthern EuropeanNorwegianOkinawanOsagePakistaniPalestinianPanamanianParaguayanPennsylvania GermanPeruvianPolishPortuguesePotawatomiPuebloPuerto RicanPuget Sound SalishRomanianRussianSalvadoranSamoanScandinavianScotch-IrishScottishSeminoleSenegaleseSerbianShoshoneSiouxSlavicSlovakSloveneSomaliSouth AfricanSouth AmericanSouth American IndianSpaniardSpanishSpanish AmericanSri LankanSubsaharan AfricanSudaneseSwedishSwissSyrianThaiTlingit-HaidaTonganTrinidadian and TobagonianTsimshianTurkishUgandanUkrainianUruguayanUteVenezuelanVietnameseWelshWest IndianYakamaYaquiYugoslavianYup'ik
Immigrant Origin (Total)
AfghanistanAfricaAlbaniaArgentinaArmeniaAsiaAustraliaAustriaBangladeshBelarusBelgiumBelizeBoliviaBosnia and HerzegovinaBrazilBulgariaBurma / MyanmarCambodiaCameroonCanadaCaribbeanCentral AmericaChileChinaColombiaCongoCosta RicaCroatiaCubaCzechoslovakiaDenmarkDominican RepublicEastern AfricaEastern AsiaEastern EuropeEcuadorEgyptEl SalvadorEnglandEritreaEthiopiaEuropeFijiFranceGermanyGhanaGreeceGuatemalaHaitiHondurasHong KongHungaryIndiaIndonesiaIranIraqIrelandIsraelItalyJamaicaJapanJordanKazakhstanKenyaKoreaKuwaitLaosLatin AmericaLatviaLebanonLiberiaLithuaniaMalaysiaMexicoMicronesiaMiddle AfricaMoldovaMoroccoNepalNetherlandsNicaraguaNigeriaNorth MacedoniaNorthern AfricaNorthern EuropeNorwayOceaniaPakistanPanamaPeruPhilippinesPolandPortugalRomaniaRussiaSaudi ArabiaScotlandSenegalSerbiaSierra LeoneSingaporeSomaliaSouth AfricaSouth AmericaSouth Central AsiaSouth Eastern AsiaSouthern EuropeSpainSri LankaSudanSwedenSwitzerlandSyriaTaiwanThailandTrinidad and TobagoTurkeyUgandaUkraineUzbekistanVenezuelaVietnamWestern AfricaWestern AsiaWestern EuropeYemenZaireZimbabwe
Immigrant Origin (Percentage)
AfghanistanAfricaAlbaniaArgentinaArmeniaAsiaAustraliaAustriaBangladeshBelarusBelgiumBelizeBoliviaBosnia and HerzegovinaBrazilBulgariaBurma / MyanmarCambodiaCameroonCanadaCaribbeanCentral AmericaChileChinaColombiaCongoCosta RicaCroatiaCubaCzechoslovakiaDenmarkDominican RepublicEastern AfricaEastern AsiaEastern EuropeEcuadorEgyptEl SalvadorEnglandEritreaEthiopiaEuropeFijiFranceGermanyGhanaGreeceGuatemalaHaitiHondurasHong KongHungaryIndiaIndonesiaIranIraqIrelandIsraelItalyJamaicaJapanJordanKazakhstanKenyaKoreaKuwaitLaosLatin AmericaLatviaLebanonLiberiaLithuaniaMalaysiaMexicoMicronesiaMiddle AfricaMoldovaMoroccoNepalNetherlandsNicaraguaNigeriaNorth MacedoniaNorthern AfricaNorthern EuropeNorwayOceaniaPakistanPanamaPeruPhilippinesPolandPortugalRomaniaRussiaSaudi ArabiaScotlandSenegalSerbiaSierra LeoneSingaporeSomaliaSouth AfricaSouth AmericaSouth Central AsiaSouth Eastern AsiaSouthern EuropeSpainSri LankaSudanSwedenSwitzerlandSyriaTaiwanThailandTrinidad and TobagoTurkeyUgandaUkraineUzbekistanVenezuelaVietnamWestern AfricaWestern AsiaWestern EuropeYemenZaireZimbabwe
Income
Income (Families)
Income (Households)
Poverty
Poverty (Families)
Unemployment
Employment Occupations
Employment Industries
Employer Class
Commute Time
Commute Means
School Enrollment
Education by Degree Field
Occupancy
Finances
Physical Characteristics
Seattle
Compare Zip Codes
Comparison Subject

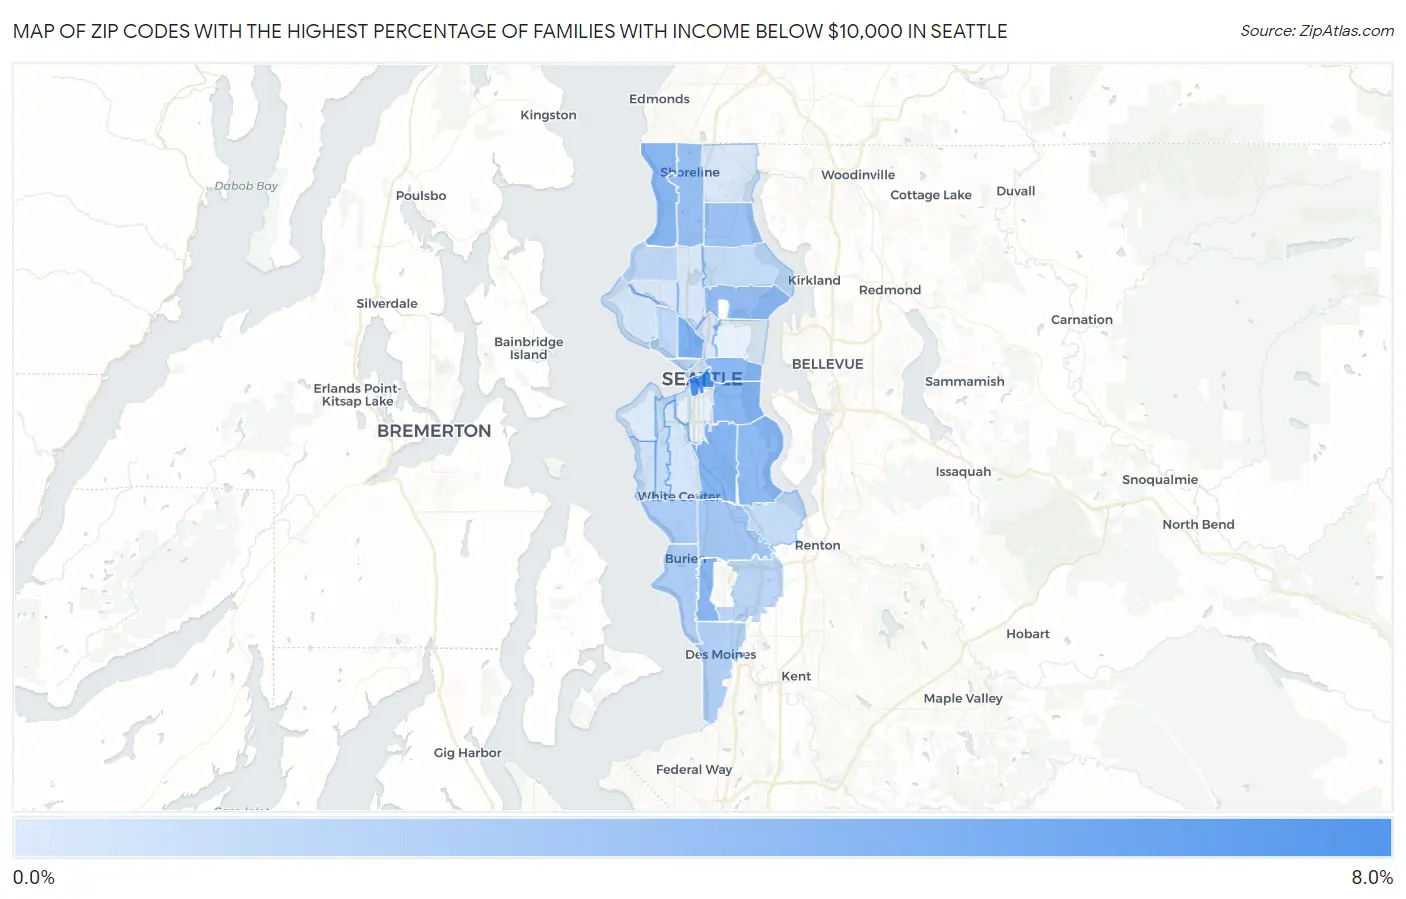
Map of Zip Codes with the Highest Percentage of Families with Income Below $10,000 in Seattle

0.0%
8.0%
Zip Codes with the Highest Percentage of Families with Income Below $10,000 in Seattle Map

Zip Codes with the Highest Percentage of Families with Income Below $10,000 in Seattle, WA

Zip Code Families with Income < $10k vs State vs National
1.981046.5%2.4%(+4.10)#483.1%(+3.40)#4,118
2.981094.2%2.4%(+1.80)#1163.1%(+1.10)#7,657
3.981084.0%2.4%(+1.60)#1213.1%(+0.900)#8,177
4.981443.8%2.4%(+1.40)#1303.1%(+0.700)#8,666
5.981773.8%2.4%(+1.40)#1313.1%(+0.700)#8,699
6.981483.8%2.4%(+1.40)#1323.1%(+0.700)#8,742
7.981223.7%2.4%(+1.30)#1353.1%(+0.600)#8,947
8.981183.6%2.4%(+1.20)#1403.1%(+0.500)#9,216
9.981053.4%2.4%(+1.00)#1513.1%(+0.300)#9,768
10.981333.2%2.4%(+0.800)#1633.1%(+0.100)#10,407
11.981253.1%2.4%(+0.700)#1723.1%(=0.000)#10,762
12.981682.8%2.4%(+0.400)#1973.1%(-0.300)#11,857
13.981462.4%2.4%(=0.000)#2233.1%(-0.700)#13,507
14.981662.3%2.4%(-0.100)#2363.1%(-0.800)#13,986
15.981982.1%2.4%(-0.300)#2533.1%(-1.000)#14,807
16.981881.8%2.4%(-0.600)#2923.1%(-1.30)#16,295
17.981211.8%2.4%(-0.600)#2953.1%(-1.30)#16,346
18.981191.7%2.4%(-0.700)#3113.1%(-1.40)#16,787
19.981171.6%2.4%(-0.800)#3223.1%(-1.50)#17,233
20.981151.4%2.4%(-1.00)#3383.1%(-1.70)#18,168
21.981781.4%2.4%(-1.00)#3413.1%(-1.70)#18,258
22.981261.4%2.4%(-1.00)#3433.1%(-1.70)#18,292
23.981011.2%2.4%(-1.20)#3623.1%(-1.90)#19,365
24.981361.0%2.4%(-1.40)#3813.1%(-2.10)#20,337
25.981060.80%2.4%(-1.60)#3993.1%(-2.30)#21,245
26.981990.80%2.4%(-1.60)#4023.1%(-2.30)#21,277
27.981550.70%2.4%(-1.70)#4113.1%(-2.40)#21,668
28.981020.70%2.4%(-1.70)#4123.1%(-2.40)#21,703
29.981030.60%2.4%(-1.80)#4143.1%(-2.50)#22,141
30.981070.60%2.4%(-1.80)#4153.1%(-2.50)#22,183
31.981160.50%2.4%(-1.90)#4233.1%(-2.60)#22,635

Common Questions

What are the Top 10 Zip Codes with the Highest Percentage of Families with Income Below $10,000 in Seattle, WA?
Top 10 Zip Codes with the Highest Percentage of Families with Income Below $10,000 in Seattle, WA are:
#1
6.5%
#2
4.2%
#3
4.0%
#4
3.8%
#5
3.8%
#6
3.8%
#7
3.7%
#8
3.6%
#9
3.4%
#10
3.2%
What zip code has the Highest Percentage of Families with Income Below $10,000 in Seattle, WA?
98104 has the Highest Percentage of Families with Income Below $10,000 in Seattle, WA with 6.5%.
What is the Percentage of Families with Income Below $10,000 in Seattle, WA?
Percentage of Families with Income Below $10,000 in Seattle is 2.1%.
What is the Percentage of Families with Income Below $10,000 in Washington?
Percentage of Families with Income Below $10,000 in Washington is 2.4%.
What is the Percentage of Families with Income Below $10,000 in the United States?
Percentage of Families with Income Below $10,000 in the United States is 3.1%.