Zip Codes with the Highest Percentage of Population Employed in Installation, Maintenance & Repair in Port Angeles, WA
RELATED REPORTS & OPTIONS
Installation, Maintenance & Repair
Port Angeles
Compare Zip Codes
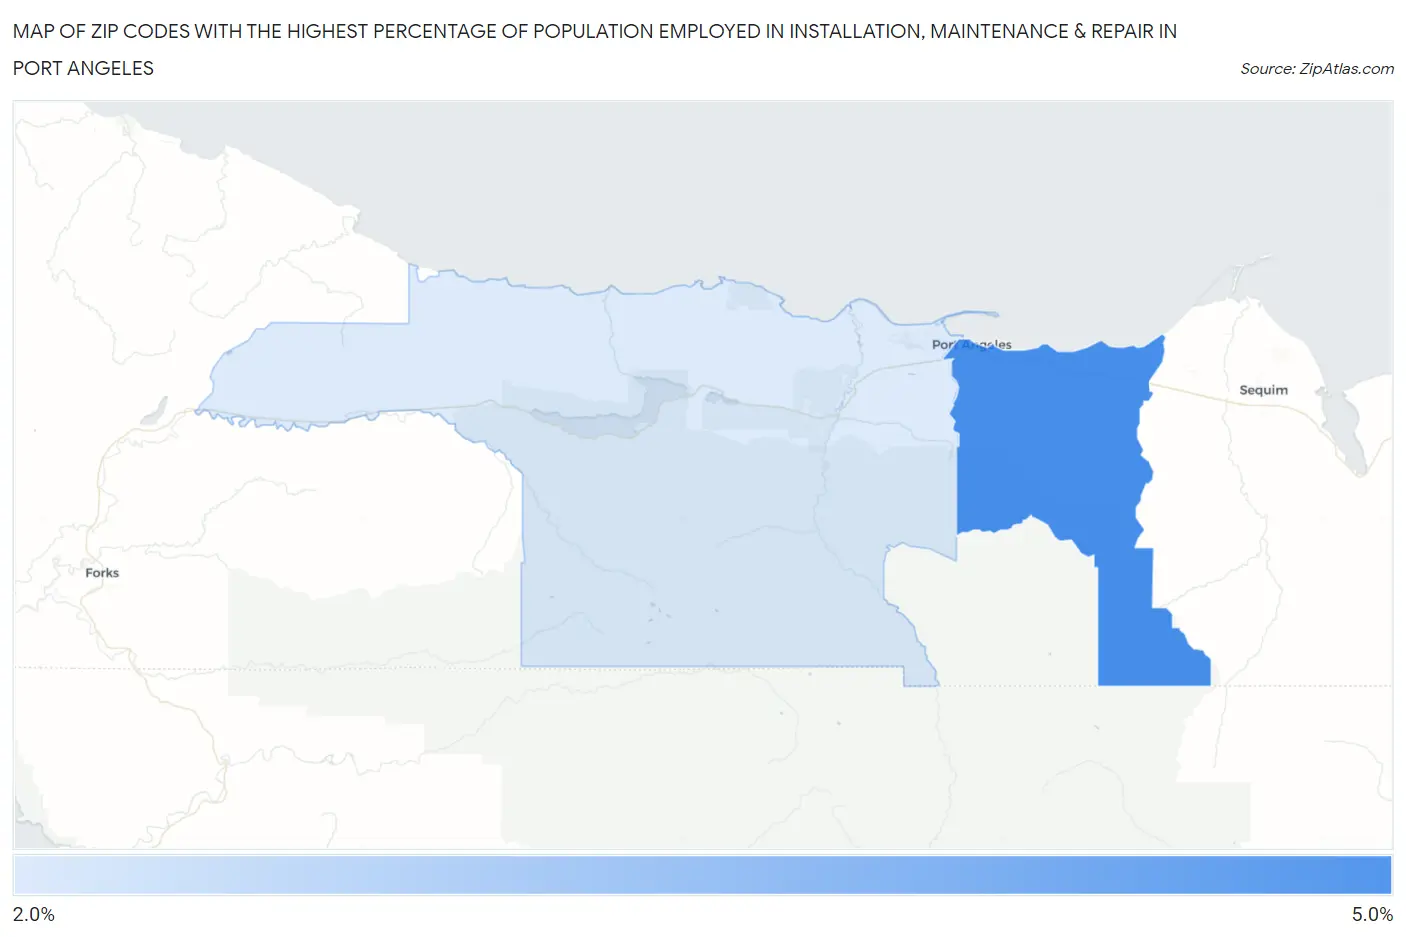
Map of Zip Codes with the Highest Percentage of Population Employed in Installation, Maintenance & Repair in Port Angeles
0.0%
5.0%
Zip Codes with the Highest Percentage of Population Employed in Installation, Maintenance & Repair in Port Angeles, WA
| Zip Code | % Employed | vs State | vs National | |
| 1. | 98362 | 4.1% | 2.9%(+1.22)#185 | 3.1%(+1.08)#11,741 |
| 2. | 98363 | 2.2% | 2.9%(-0.691)#352 | 3.1%(-0.830)#20,896 |
1
Common Questions
What are the Top Zip Codes with the Highest Percentage of Population Employed in Installation, Maintenance & Repair in Port Angeles, WA?
Top Zip Codes with the Highest Percentage of Population Employed in Installation, Maintenance & Repair in Port Angeles, WA are:
What zip code has the Highest Percentage of Population Employed in Installation, Maintenance & Repair in Port Angeles, WA?
98362 has the Highest Percentage of Population Employed in Installation, Maintenance & Repair in Port Angeles, WA with 4.1%.
What is the Percentage of Population Employed in Installation, Maintenance & Repair in Port Angeles, WA?
Percentage of Population Employed in Installation, Maintenance & Repair in Port Angeles is 2.7%.
What is the Percentage of Population Employed in Installation, Maintenance & Repair in Washington?
Percentage of Population Employed in Installation, Maintenance & Repair in Washington is 2.9%.
What is the Percentage of Population Employed in Installation, Maintenance & Repair in the United States?
Percentage of Population Employed in Installation, Maintenance & Repair in the United States is 3.1%.