Zip Codes with the Highest Percentage of Population Employed in Accommodation & Food Services in Redmond, WA
RELATED REPORTS & OPTIONS
Accommodation & Food Services
Redmond
Compare Zip Codes
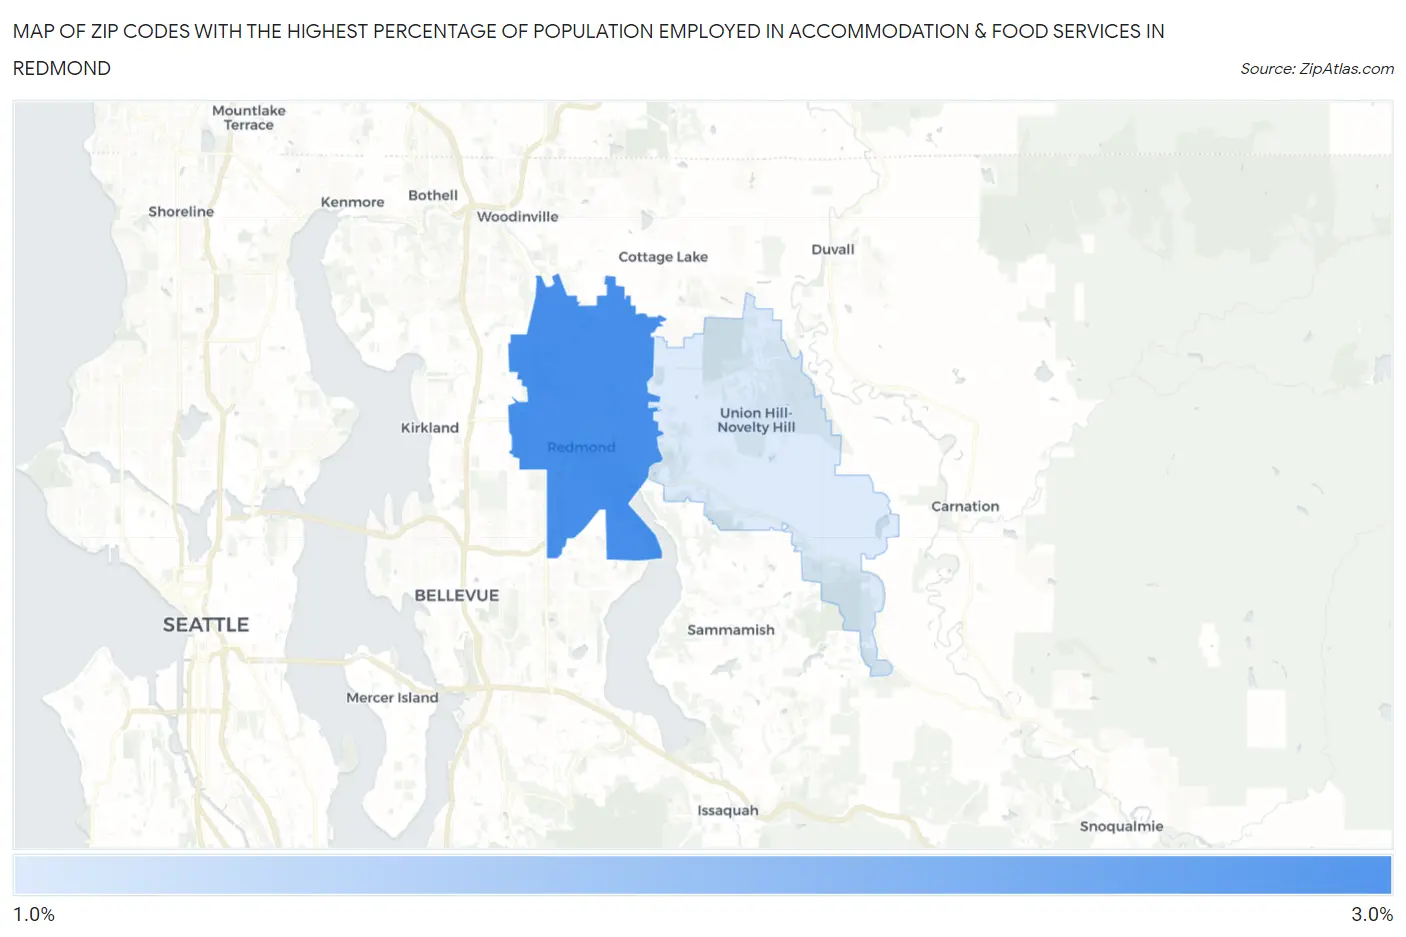
Map of Zip Codes with the Highest Percentage of Population Employed in Accommodation & Food Services in Redmond
0.0%
3.0%
Zip Codes with the Highest Percentage of Population Employed in Accommodation & Food Services in Redmond, WA
| Zip Code | % Employed | vs State | vs National | |
| 1. | 98052 | 2.8% | 6.5%(-3.64)#452 | 6.9%(-4.06)#23,690 |
| 2. | 98053 | 1.7% | 6.5%(-4.80)#482 | 6.9%(-5.22)#26,195 |
1
Common Questions
What are the Top Zip Codes with the Highest Percentage of Population Employed in Accommodation & Food Services in Redmond, WA?
Top Zip Codes with the Highest Percentage of Population Employed in Accommodation & Food Services in Redmond, WA are:
What zip code has the Highest Percentage of Population Employed in Accommodation & Food Services in Redmond, WA?
98052 has the Highest Percentage of Population Employed in Accommodation & Food Services in Redmond, WA with 2.8%.
What is the Percentage of Population Employed in Accommodation & Food Services in Redmond, WA?
Percentage of Population Employed in Accommodation & Food Services in Redmond is 2.9%.
What is the Percentage of Population Employed in Accommodation & Food Services in Washington?
Percentage of Population Employed in Accommodation & Food Services in Washington is 6.5%.
What is the Percentage of Population Employed in Accommodation & Food Services in the United States?
Percentage of Population Employed in Accommodation & Food Services in the United States is 6.9%.