Zip Codes with the Highest Percentage of Population Employed in Accommodation & Food Services in Woodinville, WA
RELATED REPORTS & OPTIONS
Accommodation & Food Services
Woodinville
Compare Zip Codes
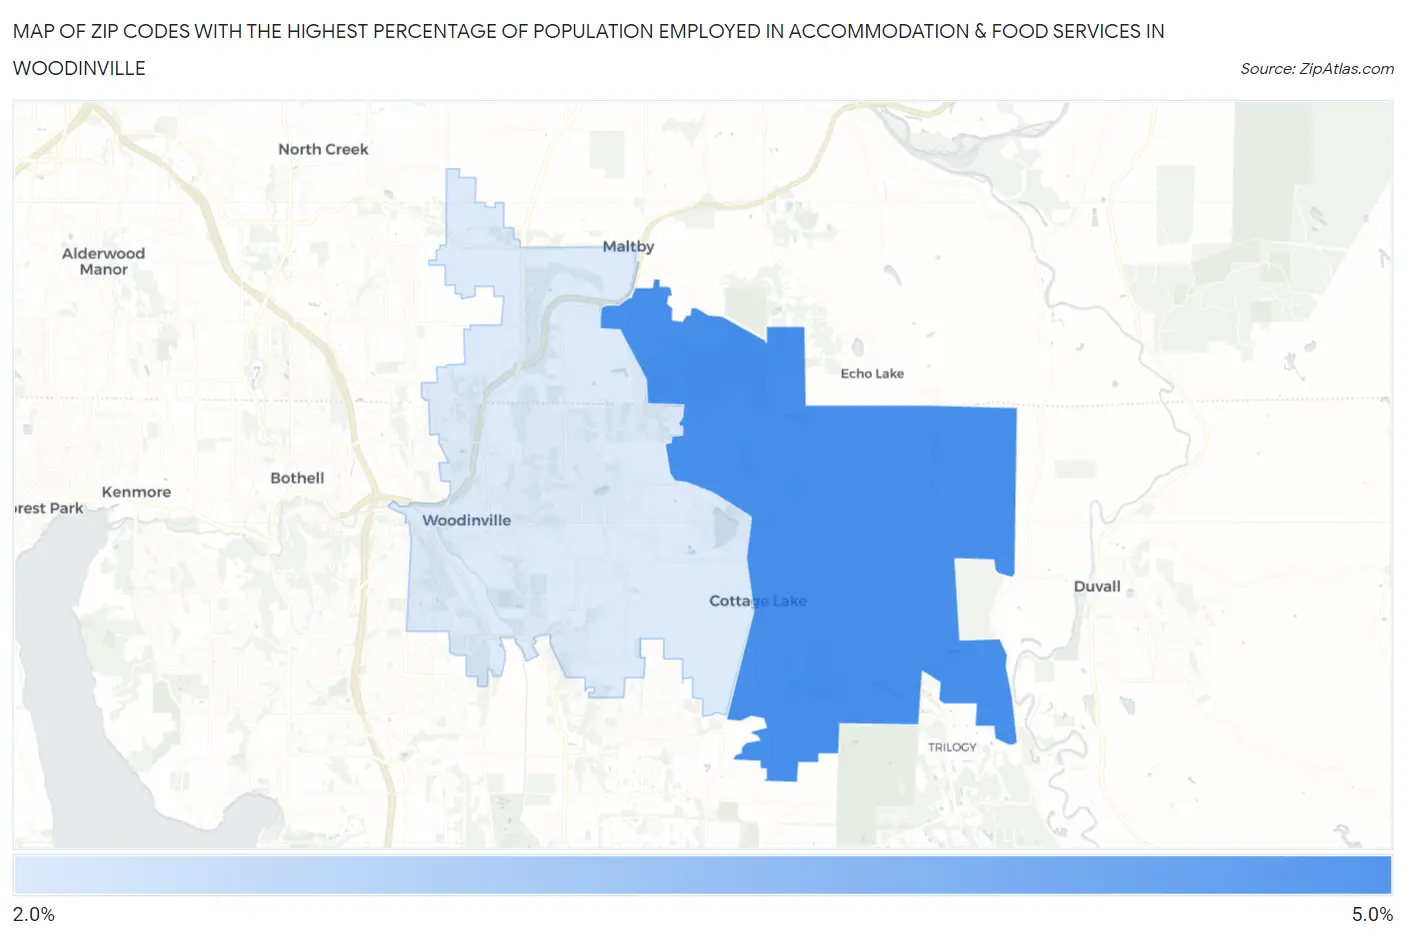
Map of Zip Codes with the Highest Percentage of Population Employed in Accommodation & Food Services in Woodinville
0.0%
5.0%
Zip Codes with the Highest Percentage of Population Employed in Accommodation & Food Services in Woodinville, WA
| Zip Code | % Employed | vs State | vs National | |
| 1. | 98077 | 4.1% | 6.5%(-2.39)#393 | 6.9%(-2.81)#19,905 |
| 2. | 98072 | 2.6% | 6.5%(-3.87)#462 | 6.9%(-4.29)#24,256 |
1
Common Questions
What are the Top Zip Codes with the Highest Percentage of Population Employed in Accommodation & Food Services in Woodinville, WA?
Top Zip Codes with the Highest Percentage of Population Employed in Accommodation & Food Services in Woodinville, WA are:
What zip code has the Highest Percentage of Population Employed in Accommodation & Food Services in Woodinville, WA?
98077 has the Highest Percentage of Population Employed in Accommodation & Food Services in Woodinville, WA with 4.1%.
What is the Percentage of Population Employed in Accommodation & Food Services in Woodinville, WA?
Percentage of Population Employed in Accommodation & Food Services in Woodinville is 3.4%.
What is the Percentage of Population Employed in Accommodation & Food Services in Washington?
Percentage of Population Employed in Accommodation & Food Services in Washington is 6.5%.
What is the Percentage of Population Employed in Accommodation & Food Services in the United States?
Percentage of Population Employed in Accommodation & Food Services in the United States is 6.9%.