Zip Codes with the Highest Percentage of Population Employed in Accommodation & Food Services in Renton, WA
RELATED REPORTS & OPTIONS
Accommodation & Food Services
Renton
Compare Zip Codes
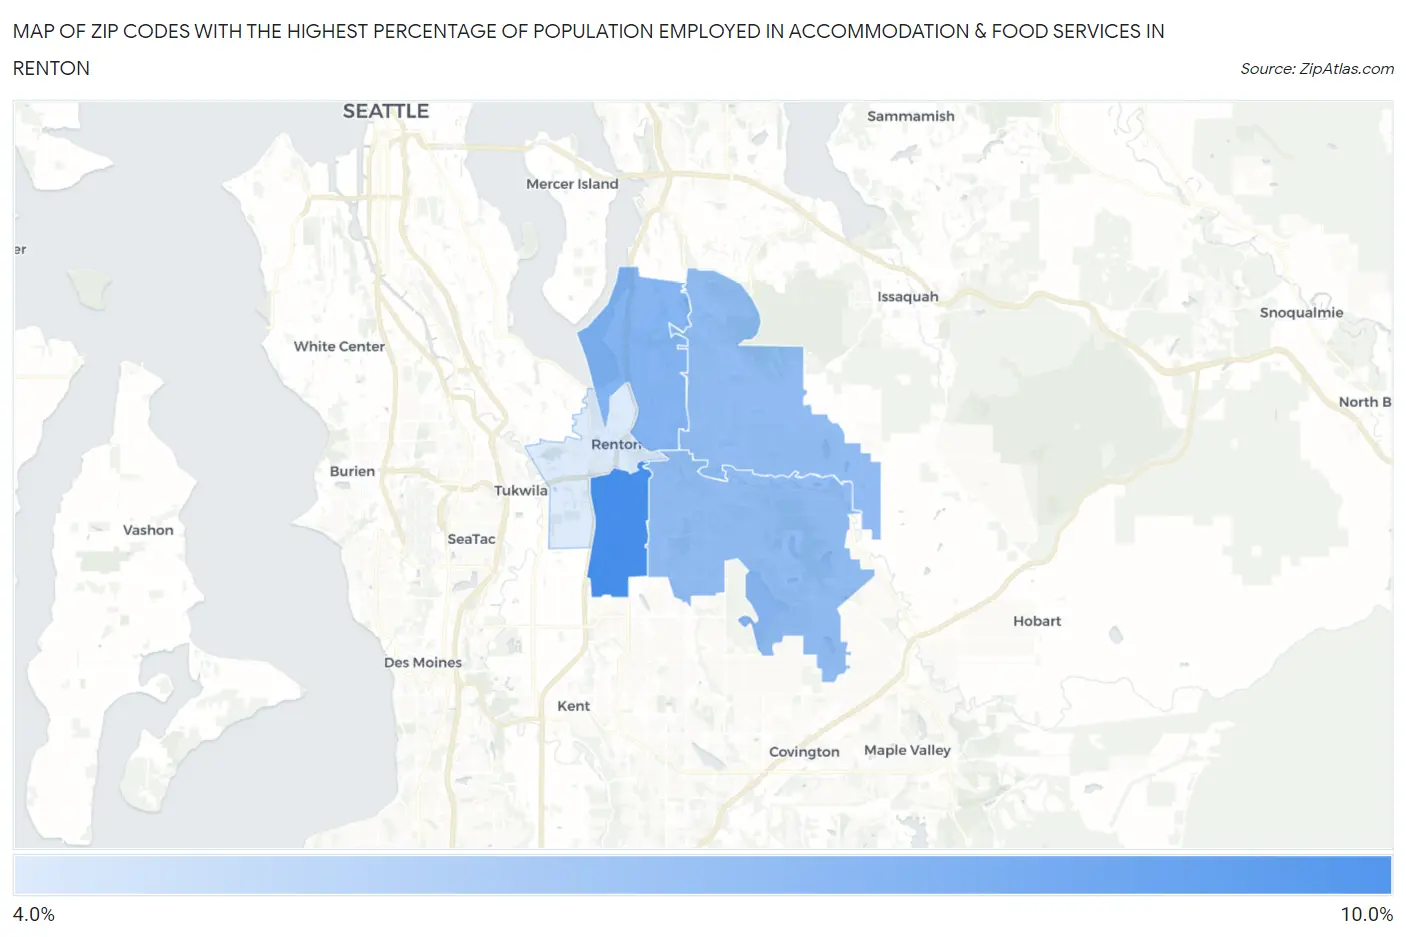
Map of Zip Codes with the Highest Percentage of Population Employed in Accommodation & Food Services in Renton
0.0%
10.0%
Zip Codes with the Highest Percentage of Population Employed in Accommodation & Food Services in Renton, WA
| Zip Code | % Employed | vs State | vs National | |
| 1. | 98055 | 8.9% | 6.5%(+2.46)#101 | 6.9%(+2.04)#6,093 |
| 2. | 98056 | 7.3% | 6.5%(+0.789)#182 | 6.9%(+0.371)#9,668 |
| 3. | 98058 | 6.9% | 6.5%(+0.473)#200 | 6.9%(+0.054)#10,511 |
| 4. | 98059 | 6.9% | 6.5%(+0.443)#202 | 6.9%(+0.024)#10,585 |
| 5. | 98057 | 4.9% | 6.5%(-1.56)#339 | 6.9%(-1.98)#17,172 |
1
Common Questions
What are the Top 3 Zip Codes with the Highest Percentage of Population Employed in Accommodation & Food Services in Renton, WA?
Top 3 Zip Codes with the Highest Percentage of Population Employed in Accommodation & Food Services in Renton, WA are:
What zip code has the Highest Percentage of Population Employed in Accommodation & Food Services in Renton, WA?
98055 has the Highest Percentage of Population Employed in Accommodation & Food Services in Renton, WA with 8.9%.
What is the Percentage of Population Employed in Accommodation & Food Services in Renton, WA?
Percentage of Population Employed in Accommodation & Food Services in Renton is 8.1%.
What is the Percentage of Population Employed in Accommodation & Food Services in Washington?
Percentage of Population Employed in Accommodation & Food Services in Washington is 6.5%.
What is the Percentage of Population Employed in Accommodation & Food Services in the United States?
Percentage of Population Employed in Accommodation & Food Services in the United States is 6.9%.