Immigrants from Uruguay vs Immigrants from Austria 3 or more Vehicles in Household

COMPARE

Immigrants from Uruguay
Race
Ancestry
AfghanAfricanAlaska NativeAlaskan AthabascanAlbanianAleutAlsatianAmericanApacheArabArapahoArgentineanArmenianAssyrian/Chaldean/SyriacAustralianAustrianBahamianBangladeshiBarbadianBasqueBelgianBelizeanBermudanBhutaneseBlackfeetBolivianBrazilianBritishBritish West IndianBulgarianBurmeseCajunCambodianCanadianCape VerdeanCarpatho RusynCelticCentral AmericanCentral American IndianCherokeeCheyenneChickasawChileanChineseChippewaChoctawColombianColvilleComancheCosta RicanCreeCreekCroatianCrowCubanCypriotCzechCzechoslovakianDanishDelawareDominicanDutchDutch West IndianEastern EuropeanEcuadorianEgyptianEnglishEstonianEthiopianEuropeanFijianFilipinoFinnishFrenchFrench American IndianFrench CanadianGermanGerman RussianGhanaianGreekGuamanian/ChamorroGuatemalanGuyaneseHaitianHmongHonduranHopiHoumaHungarianIcelanderIndian (Asian)IndonesianInupiatIranianIraqiIrishIroquoisIsraeliItalianJamaicanJapaneseJordanianKenyanKiowaKoreanLaotianLatvianLebaneseLiberianLithuanianLumbeeLuxembourgerMacedonianMalaysianMalteseMarshalleseMenomineeMexicanMexican American IndianMongolianMoroccanNative HawaiianNavajoNepaleseNew ZealanderNicaraguanNigerianNorthern EuropeanNorwegianOkinawanOsageOttawaPaiutePakistaniPalestinianPanamanianParaguayanPennsylvania GermanPeruvianPimaPolishPortuguesePotawatomiPuebloPuerto RicanPuget Sound SalishRomanianRussianSalvadoranSamoanScandinavianScotch-IrishScottishSeminoleSenegaleseSerbianShoshoneSierra LeoneanSiouxSlavicSlovakSloveneSomaliSouth AfricanSouth AmericanSouth American IndianSoviet UnionSpaniardSpanishSpanish AmericanSpanish American IndianSri LankanSubsaharan AfricanSudaneseSwedishSwissSyrianTaiwaneseThaiTlingit-HaidaTohono O'OdhamTonganTrinidadian and TobagonianTsimshianTurkishU.S. Virgin IslanderUgandanUkrainianUruguayanUteVenezuelanVietnameseWelshWest IndianYakamaYaquiYugoslavianYumanYup'ikZimbabwean
Immigration
NonimmigrantsImmigrantsAfghanistanAfricaAlbaniaArgentinaArmeniaAsiaAustraliaBahamasBangladeshBarbadosBelarusBelgiumBelizeBoliviaBosnia and HerzegovinaBrazilBulgariaBurma/MyanmarCabo VerdeCambodiaCameroonCanadaCaribbeanCentral AmericaChileChinaColombiaCongoCosta RicaCroatiaCubaCzechoslovakiaDenmarkDominicaDominican RepublicEastern AfricaEastern AsiaEastern EuropeEcuadorEgyptEl SalvadorEnglandEritreaEthiopiaEuropeFijiFranceGermanyGhanaGreeceGrenadaGuatemalaGuyanaHaitiHondurasHong KongHungaryIndiaIndonesiaIranIraqIrelandIsraelItalyJamaicaJapanJordanKazakhstanKenyaKoreaKuwaitLaosLatin AmericaLatviaLebanonLiberiaLithuaniaMalaysiaMexicoMicronesiaMiddle AfricaMoldovaMoroccoNepalNetherlandsNicaraguaNigeriaNorth AmericaNorth MacedoniaNorthern AfricaNorthern EuropeNorwayOceaniaPakistanPanamaPeruPhilippinesPolandPortugalRomaniaRussiaSaudi ArabiaScotlandSenegalSerbiaSierra LeoneSingaporeSomaliaSouth AfricaSouth AmericaSouth Central AsiaSouth Eastern AsiaSouthern EuropeSpainSri LankaSt. Vincent and the GrenadinesSudanSwedenSwitzerlandSyriaTaiwanThailandTrinidad and TobagoTurkeyUgandaUkraineUruguayUzbekistanVenezuelaVietnamWest IndiesWestern AfricaWestern AsiaWestern EuropeYemenZaireZimbabweAzores
Immigrants from Austria
Race
Ancestry
AfghanAfricanAlaska NativeAlaskan AthabascanAlbanianAleutAlsatianAmericanApacheArabArapahoArgentineanArmenianAssyrian/Chaldean/SyriacAustralianAustrianBahamianBangladeshiBarbadianBasqueBelgianBelizeanBermudanBhutaneseBlackfeetBolivianBrazilianBritishBritish West IndianBulgarianBurmeseCajunCambodianCanadianCape VerdeanCarpatho RusynCelticCentral AmericanCentral American IndianCherokeeCheyenneChickasawChileanChineseChippewaChoctawColombianColvilleComancheCosta RicanCreeCreekCroatianCrowCubanCypriotCzechCzechoslovakianDanishDelawareDominicanDutchDutch West IndianEastern EuropeanEcuadorianEgyptianEnglishEstonianEthiopianEuropeanFijianFilipinoFinnishFrenchFrench American IndianFrench CanadianGermanGerman RussianGhanaianGreekGuamanian/ChamorroGuatemalanGuyaneseHaitianHmongHonduranHopiHoumaHungarianIcelanderIndian (Asian)IndonesianInupiatIranianIraqiIrishIroquoisIsraeliItalianJamaicanJapaneseJordanianKenyanKiowaKoreanLaotianLatvianLebaneseLiberianLithuanianLumbeeLuxembourgerMacedonianMalaysianMalteseMarshalleseMenomineeMexicanMexican American IndianMongolianMoroccanNative HawaiianNavajoNepaleseNew ZealanderNicaraguanNigerianNorthern EuropeanNorwegianOkinawanOsageOttawaPaiutePakistaniPalestinianPanamanianParaguayanPennsylvania GermanPeruvianPimaPolishPortuguesePotawatomiPuebloPuerto RicanPuget Sound SalishRomanianRussianSalvadoranSamoanScandinavianScotch-IrishScottishSeminoleSenegaleseSerbianShoshoneSierra LeoneanSiouxSlavicSlovakSloveneSomaliSouth AfricanSouth AmericanSouth American IndianSoviet UnionSpaniardSpanishSpanish AmericanSpanish American IndianSri LankanSubsaharan AfricanSudaneseSwedishSwissSyrianTaiwaneseThaiTlingit-HaidaTohono O'OdhamTonganTrinidadian and TobagonianTsimshianTurkishU.S. Virgin IslanderUgandanUkrainianUruguayanUteVenezuelanVietnameseWelshWest IndianYakamaYaquiYugoslavianYumanYup'ikZimbabwean
Immigration
NonimmigrantsImmigrantsAfghanistanAfricaAlbaniaArgentinaArmeniaAsiaAustraliaAustriaBahamasBangladeshBarbadosBelarusBelgiumBelizeBoliviaBosnia and HerzegovinaBrazilBulgariaBurma/MyanmarCabo VerdeCambodiaCameroonCanadaCaribbeanCentral AmericaChileChinaColombiaCongoCosta RicaCroatiaCubaCzechoslovakiaDenmarkDominicaDominican RepublicEastern AfricaEastern AsiaEastern EuropeEcuadorEgyptEl SalvadorEnglandEritreaEthiopiaEuropeFijiFranceGermanyGhanaGreeceGrenadaGuatemalaGuyanaHaitiHondurasHong KongHungaryIndiaIndonesiaIranIraqIrelandIsraelItalyJamaicaJapanJordanKazakhstanKenyaKoreaKuwaitLaosLatin AmericaLatviaLebanonLiberiaLithuaniaMalaysiaMexicoMicronesiaMiddle AfricaMoldovaMoroccoNepalNetherlandsNicaraguaNigeriaNorth AmericaNorth MacedoniaNorthern AfricaNorthern EuropeNorwayOceaniaPakistanPanamaPeruPhilippinesPolandPortugalRomaniaRussiaSaudi ArabiaScotlandSenegalSerbiaSierra LeoneSingaporeSomaliaSouth AfricaSouth AmericaSouth Central AsiaSouth Eastern AsiaSouthern EuropeSpainSri LankaSt. Vincent and the GrenadinesSudanSwedenSwitzerlandSyriaTaiwanThailandTrinidad and TobagoTurkeyUgandaUkraineUzbekistanVenezuelaVietnamWest IndiesWestern AfricaWestern AsiaWestern EuropeYemenZaireZimbabweAzores
3 or more Vehicles in Household
Income
Poverty
Unemployment
Labor Participation
Family Structure
Vehicle Availability
Education Level
Disability

3 or more Vehicles in Household Comparison

Immigrants from Uruguay

Immigrants from Austria

Tragic
Poor
17.1%
3 OR MORE VEHICLES IN HOUSEHOLD
0.2/ 100
METRIC RATING
288th/ 347
METRIC RANK
18.9%
3 OR MORE VEHICLES IN HOUSEHOLD
15.4/ 100
METRIC RATING
202nd/ 347
METRIC RANK

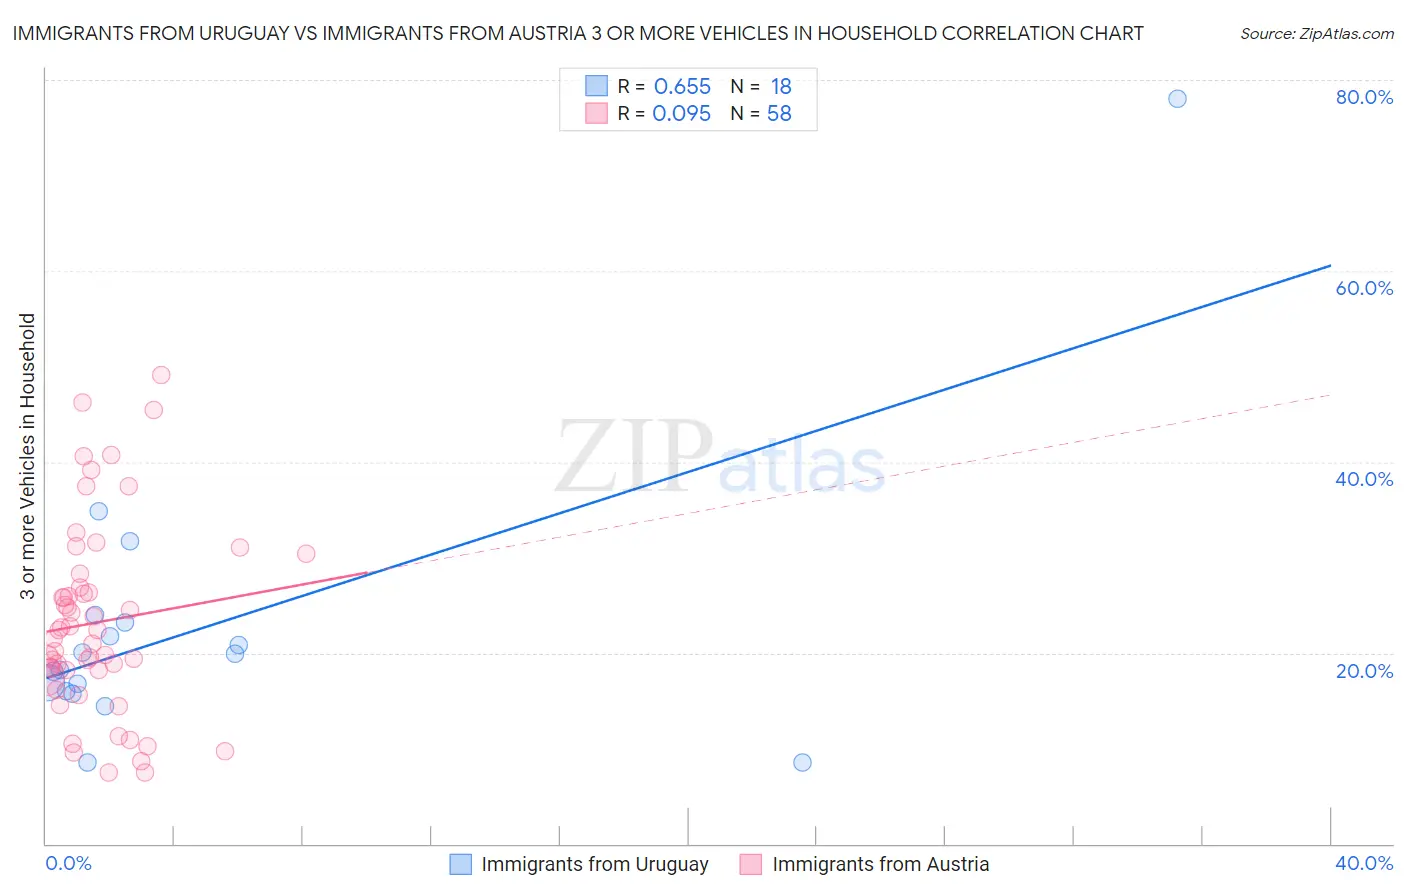
Immigrants from Uruguay vs Immigrants from Austria 3 or more Vehicles in Household Correlation Chart

The statistical analysis conducted on geographies consisting of 133,238,313 people shows a significant positive correlation between the proportion of Immigrants from Uruguay and percentage of households with 3 or more vehicles available in the United States with a correlation coefficient (R) of 0.655 and weighted average of 17.1%. Similarly, the statistical analysis conducted on geographies consisting of 167,924,568 people shows a slight positive correlation between the proportion of Immigrants from Austria and percentage of households with 3 or more vehicles available in the United States with a correlation coefficient (R) of 0.095 and weighted average of 18.9%, a difference of 10.3%.
Immigrants from Uruguay vs Immigrants from Austria 3 or more Vehicles in Household

3 or more Vehicles in Household Correlation Summary

MeasurementImmigrants from UruguayImmigrants from Austria
Minimum8.6%7.4%
Maximum78.0%49.1%
Range69.5%41.7%
Mean22.6%23.2%
Median19.0%21.9%
Interquartile 25% (IQ1)16.0%18.2%
Interquartile 75% (IQ3)23.1%26.9%
Interquartile Range (IQR)7.1%8.7%
Standard Deviation (Sample)15.3%9.9%
Standard Deviation (Population)14.9%9.8%

Similar Demographics by 3 or more Vehicles in Household

Demographics Similar to Immigrants from Uruguay by 3 or more Vehicles in Household

In terms of 3 or more vehicles in household, the demographic groups most similar to Immigrants from Uruguay are Immigrants from Liberia (17.1%, a difference of 0.070%), Immigrants from Brazil (17.1%, a difference of 0.090%), Menominee (17.2%, a difference of 0.39%), Immigrants from Croatia (17.2%, a difference of 0.45%), and Liberian (17.0%, a difference of 0.64%).
DemographicsRating | Rank3 or more Vehicles in Household
Immigrants | Latvia
0.3
/100
|
#281
Tragic
17.4%
Immigrants | Ireland
0.3
/100
|
#282
Tragic
17.3%
Blacks/African Americans
0.3
/100
|
#283
Tragic
17.3%
Immigrants | Colombia
0.3
/100
|
#284
Tragic
17.3%
Immigrants | Croatia
0.2
/100
|
#285
Tragic
17.2%
Menominee
0.2
/100
|
#286
Tragic
17.2%
Immigrants | Brazil
0.2
/100
|
#287
Tragic
17.1%
Immigrants | Uruguay
0.2
/100
|
#288
Tragic
17.1%
Immigrants | Liberia
0.1
/100
|
#289
Tragic
17.1%
Liberians
0.1
/100
|
#290
Tragic
17.0%
Immigrants | Congo
0.1
/100
|
#291
Tragic
17.0%
Immigrants | Spain
0.1
/100
|
#292
Tragic
17.0%
Bahamians
0.1
/100
|
#293
Tragic
16.9%
Immigrants | Western Africa
0.1
/100
|
#294
Tragic
16.9%
Immigrants | Russia
0.1
/100
|
#295
Tragic
16.9%

Demographics Similar to Immigrants from Austria by 3 or more Vehicles in Household

In terms of 3 or more vehicles in household, the demographic groups most similar to Immigrants from Austria are Tohono O'odham (18.9%, a difference of 0.090%), Immigrants from Romania (18.9%, a difference of 0.12%), Russian (18.8%, a difference of 0.19%), Immigrants from Eastern Asia (18.8%, a difference of 0.20%), and Immigrants from Chile (18.8%, a difference of 0.28%).
DemographicsRating | Rank3 or more Vehicles in Household
Immigrants | Moldova
23.6
/100
|
#195
Fair
19.1%
Central American Indians
22.2
/100
|
#196
Fair
19.0%
Immigrants | Japan
22.0
/100
|
#197
Fair
19.0%
Egyptians
19.5
/100
|
#198
Poor
19.0%
Immigrants | Norway
19.0
/100
|
#199
Poor
19.0%
Argentineans
18.2
/100
|
#200
Poor
18.9%
Arabs
17.7
/100
|
#201
Poor
18.9%
Immigrants | Austria
15.4
/100
|
#202
Poor
18.9%
Tohono O'odham
14.8
/100
|
#203
Poor
18.9%
Immigrants | Romania
14.6
/100
|
#204
Poor
18.9%
Russians
14.2
/100
|
#205
Poor
18.8%
Immigrants | Eastern Asia
14.1
/100
|
#206
Poor
18.8%
Immigrants | Chile
13.6
/100
|
#207
Poor
18.8%
Immigrants | Burma/Myanmar
13.6
/100
|
#208
Poor
18.8%
Immigrants | Egypt
13.5
/100
|
#209
Poor
18.8%