Immigrants from Philippines vs Immigrants from Netherlands 2 or more Vehicles in Household

COMPARE

Immigrants from Philippines
Race
Ancestry
AfghanAfricanAlaska NativeAlaskan AthabascanAlbanianAleutAlsatianAmericanApacheArabArapahoArgentineanArmenianAssyrian/Chaldean/SyriacAustralianAustrianBahamianBangladeshiBarbadianBasqueBelgianBelizeanBermudanBhutaneseBlackfeetBolivianBrazilianBritishBritish West IndianBulgarianBurmeseCajunCambodianCanadianCape VerdeanCarpatho RusynCelticCentral AmericanCentral American IndianCherokeeCheyenneChickasawChileanChineseChippewaChoctawColombianColvilleComancheCosta RicanCreeCreekCroatianCrowCubanCypriotCzechCzechoslovakianDanishDelawareDominicanDutchDutch West IndianEastern EuropeanEcuadorianEgyptianEnglishEstonianEthiopianEuropeanFijianFilipinoFinnishFrenchFrench American IndianFrench CanadianGermanGerman RussianGhanaianGreekGuamanian/ChamorroGuatemalanGuyaneseHaitianHmongHonduranHopiHoumaHungarianIcelanderIndian (Asian)IndonesianInupiatIranianIraqiIrishIroquoisIsraeliItalianJamaicanJapaneseJordanianKenyanKiowaKoreanLaotianLatvianLebaneseLiberianLithuanianLumbeeLuxembourgerMacedonianMalaysianMalteseMarshalleseMenomineeMexicanMexican American IndianMongolianMoroccanNative HawaiianNavajoNepaleseNew ZealanderNicaraguanNigerianNorthern EuropeanNorwegianOkinawanOsageOttawaPaiutePakistaniPalestinianPanamanianParaguayanPennsylvania GermanPeruvianPimaPolishPortuguesePotawatomiPuebloPuerto RicanPuget Sound SalishRomanianRussianSalvadoranSamoanScandinavianScotch-IrishScottishSeminoleSenegaleseSerbianShoshoneSierra LeoneanSiouxSlavicSlovakSloveneSomaliSouth AfricanSouth AmericanSouth American IndianSoviet UnionSpaniardSpanishSpanish AmericanSpanish American IndianSri LankanSubsaharan AfricanSudaneseSwedishSwissSyrianTaiwaneseThaiTlingit-HaidaTohono O'OdhamTonganTrinidadian and TobagonianTsimshianTurkishU.S. Virgin IslanderUgandanUkrainianUruguayanUteVenezuelanVietnameseWelshWest IndianYakamaYaquiYugoslavianYumanYup'ikZimbabwean
Immigration
NonimmigrantsImmigrantsAfghanistanAfricaAlbaniaArgentinaArmeniaAsiaAustraliaAustriaBahamasBangladeshBarbadosBelarusBelgiumBelizeBoliviaBosnia and HerzegovinaBrazilBulgariaBurma/MyanmarCabo VerdeCambodiaCameroonCanadaCaribbeanCentral AmericaChileChinaColombiaCongoCosta RicaCroatiaCubaCzechoslovakiaDenmarkDominicaDominican RepublicEastern AfricaEastern AsiaEastern EuropeEcuadorEgyptEl SalvadorEnglandEritreaEthiopiaEuropeFijiFranceGermanyGhanaGreeceGrenadaGuatemalaGuyanaHaitiHondurasHong KongHungaryIndiaIndonesiaIranIraqIrelandIsraelItalyJamaicaJapanJordanKazakhstanKenyaKoreaKuwaitLaosLatin AmericaLatviaLebanonLiberiaLithuaniaMalaysiaMexicoMicronesiaMiddle AfricaMoldovaMoroccoNepalNicaraguaNigeriaNorth AmericaNorth MacedoniaNorthern AfricaNorthern EuropeNorwayOceaniaPakistanPanamaPeruPhilippinesPolandPortugalRomaniaRussiaSaudi ArabiaScotlandSenegalSerbiaSierra LeoneSingaporeSomaliaSouth AfricaSouth AmericaSouth Central AsiaSouth Eastern AsiaSouthern EuropeSpainSri LankaSt. Vincent and the GrenadinesSudanSwedenSwitzerlandSyriaTaiwanThailandTrinidad and TobagoTurkeyUgandaUkraineUruguayUzbekistanVenezuelaVietnamWest IndiesWestern AfricaWestern AsiaWestern EuropeYemenZaireZimbabweAzores
Immigrants from Netherlands
Race
Ancestry
AfghanAfricanAlaska NativeAlaskan AthabascanAlbanianAleutAlsatianAmericanApacheArabArapahoArgentineanArmenianAssyrian/Chaldean/SyriacAustralianAustrianBahamianBangladeshiBarbadianBasqueBelgianBelizeanBermudanBhutaneseBlackfeetBolivianBrazilianBritishBritish West IndianBulgarianBurmeseCajunCambodianCanadianCape VerdeanCarpatho RusynCelticCentral AmericanCentral American IndianCherokeeCheyenneChickasawChileanChineseChippewaChoctawColombianColvilleComancheCosta RicanCreeCreekCroatianCrowCubanCypriotCzechCzechoslovakianDanishDelawareDominicanDutchDutch West IndianEastern EuropeanEcuadorianEgyptianEnglishEstonianEthiopianEuropeanFijianFilipinoFinnishFrenchFrench American IndianFrench CanadianGermanGerman RussianGhanaianGreekGuamanian/ChamorroGuatemalanGuyaneseHaitianHmongHonduranHopiHoumaHungarianIcelanderIndian (Asian)IndonesianInupiatIranianIraqiIrishIroquoisIsraeliItalianJamaicanJapaneseJordanianKenyanKiowaKoreanLaotianLatvianLebaneseLiberianLithuanianLumbeeLuxembourgerMacedonianMalaysianMalteseMarshalleseMenomineeMexicanMexican American IndianMongolianMoroccanNative HawaiianNavajoNepaleseNew ZealanderNicaraguanNigerianNorthern EuropeanNorwegianOkinawanOsageOttawaPaiutePakistaniPalestinianPanamanianParaguayanPennsylvania GermanPeruvianPimaPolishPortuguesePotawatomiPuebloPuerto RicanPuget Sound SalishRomanianRussianSalvadoranSamoanScandinavianScotch-IrishScottishSeminoleSenegaleseSerbianShoshoneSierra LeoneanSiouxSlavicSlovakSloveneSomaliSouth AfricanSouth AmericanSouth American IndianSoviet UnionSpaniardSpanishSpanish AmericanSpanish American IndianSri LankanSubsaharan AfricanSudaneseSwedishSwissSyrianTaiwaneseThaiTlingit-HaidaTohono O'OdhamTonganTrinidadian and TobagonianTsimshianTurkishU.S. Virgin IslanderUgandanUkrainianUruguayanUteVenezuelanVietnameseWelshWest IndianYakamaYaquiYugoslavianYumanYup'ikZimbabwean
Immigration
NonimmigrantsImmigrantsAfghanistanAfricaAlbaniaArgentinaArmeniaAsiaAustraliaAustriaBahamasBangladeshBarbadosBelarusBelgiumBelizeBoliviaBosnia and HerzegovinaBrazilBulgariaBurma/MyanmarCabo VerdeCambodiaCameroonCanadaCaribbeanCentral AmericaChileChinaColombiaCongoCosta RicaCroatiaCubaCzechoslovakiaDenmarkDominicaDominican RepublicEastern AfricaEastern AsiaEastern EuropeEcuadorEgyptEl SalvadorEnglandEritreaEthiopiaEuropeFijiFranceGermanyGhanaGreeceGrenadaGuatemalaGuyanaHaitiHondurasHong KongHungaryIndiaIndonesiaIranIraqIrelandIsraelItalyJamaicaJapanJordanKazakhstanKenyaKoreaKuwaitLaosLatin AmericaLatviaLebanonLiberiaLithuaniaMalaysiaMexicoMicronesiaMiddle AfricaMoldovaMoroccoNepalNetherlandsNicaraguaNigeriaNorth AmericaNorth MacedoniaNorthern AfricaNorthern EuropeNorwayOceaniaPakistanPanamaPeruPolandPortugalRomaniaRussiaSaudi ArabiaScotlandSenegalSerbiaSierra LeoneSingaporeSomaliaSouth AfricaSouth AmericaSouth Central AsiaSouth Eastern AsiaSouthern EuropeSpainSri LankaSt. Vincent and the GrenadinesSudanSwedenSwitzerlandSyriaTaiwanThailandTrinidad and TobagoTurkeyUgandaUkraineUruguayUzbekistanVenezuelaVietnamWest IndiesWestern AfricaWestern AsiaWestern EuropeYemenZaireZimbabweAzores
2 or more Vehicles in Household
Income
Poverty
Unemployment
Labor Participation
Family Structure
Vehicle Availability
Education Level
Disability

2 or more Vehicles in Household Comparison

Immigrants from Philippines

Immigrants from Netherlands

Exceptional
Exceptional
60.1%
2 OR MORE VEHICLES IN HOUSEHOLD
100.0/ 100
METRIC RATING
35th/ 347
METRIC RANK
57.5%
2 OR MORE VEHICLES IN HOUSEHOLD
98.2/ 100
METRIC RATING
107th/ 347
METRIC RANK

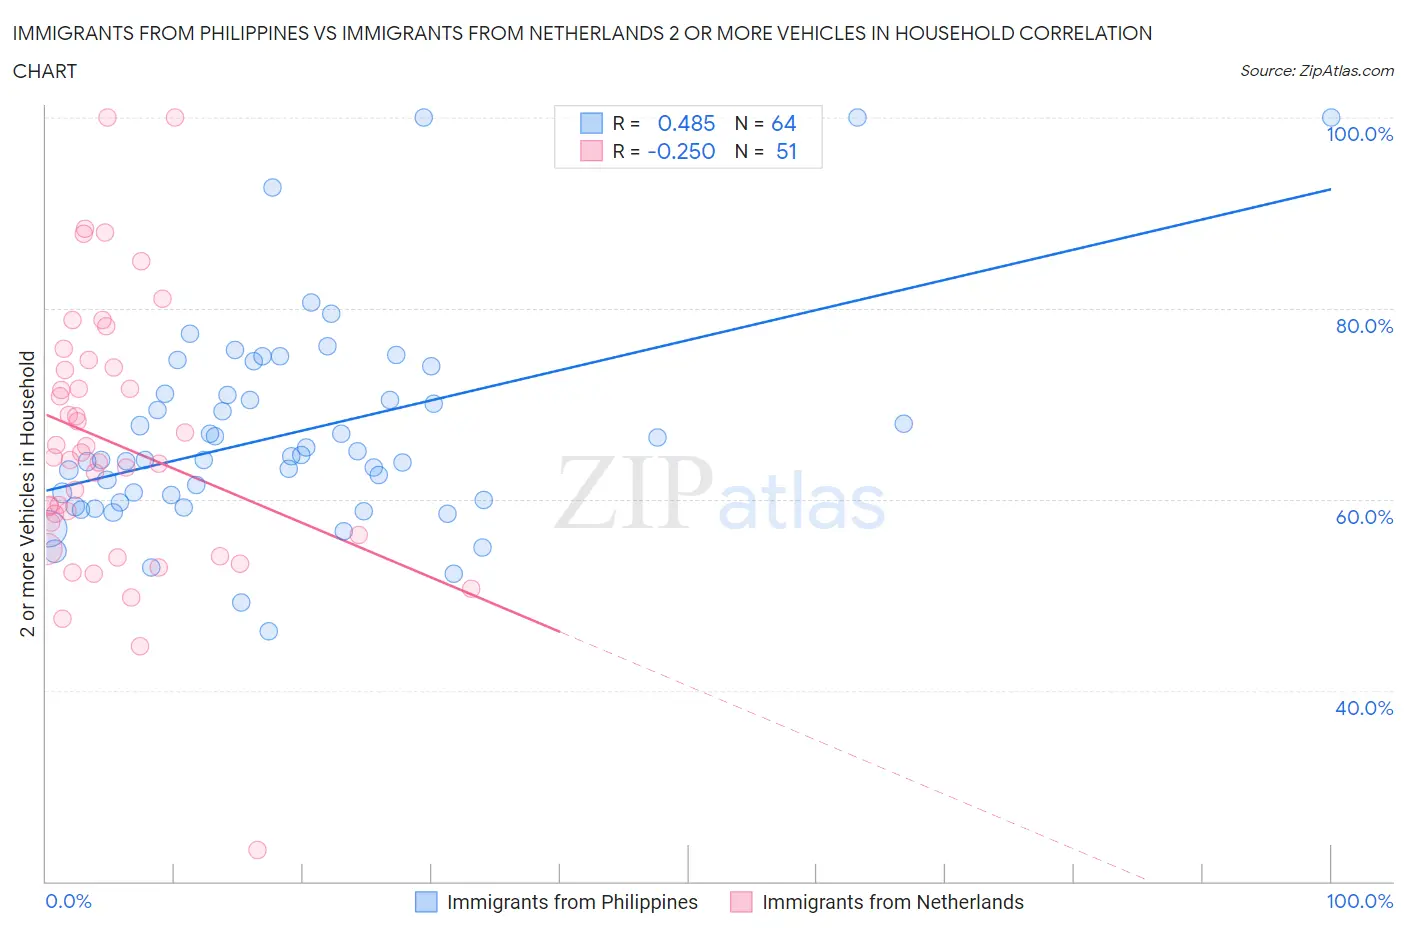
Immigrants from Philippines vs Immigrants from Netherlands 2 or more Vehicles in Household Correlation Chart

The statistical analysis conducted on geographies consisting of 471,056,019 people shows a moderate positive correlation between the proportion of Immigrants from Philippines and percentage of households with 2 or more vehicles available in the United States with a correlation coefficient (R) of 0.485 and weighted average of 60.1%. Similarly, the statistical analysis conducted on geographies consisting of 237,817,219 people shows a weak negative correlation between the proportion of Immigrants from Netherlands and percentage of households with 2 or more vehicles available in the United States with a correlation coefficient (R) of -0.250 and weighted average of 57.5%, a difference of 4.5%.
Immigrants from Philippines vs Immigrants from Netherlands 2 or more Vehicles in Household

2 or more Vehicles in Household Correlation Summary

MeasurementImmigrants from PhilippinesImmigrants from Netherlands
Minimum46.2%23.3%
Maximum100.0%100.0%
Range53.8%76.7%
Mean66.9%65.9%
Median64.3%64.4%
Interquartile 25% (IQ1)59.8%56.2%
Interquartile 75% (IQ3)71.0%73.9%
Interquartile Range (IQR)11.2%17.6%
Standard Deviation (Sample)10.9%14.1%
Standard Deviation (Population)10.8%14.0%

Similar Demographics by 2 or more Vehicles in Household

Demographics Similar to Immigrants from Philippines by 2 or more Vehicles in Household

In terms of 2 or more vehicles in household, the demographic groups most similar to Immigrants from Philippines are Chinese (60.1%, a difference of 0.020%), Irish (60.1%, a difference of 0.060%), Spanish (60.2%, a difference of 0.12%), American (60.0%, a difference of 0.12%), and British (60.0%, a difference of 0.12%).
DemographicsRating | Rank2 or more Vehicles in Household
Guamanians/Chamorros
100.0
/100
|
#28
Exceptional
60.5%
Hawaiians
100.0
/100
|
#29
Exceptional
60.4%
Finns
100.0
/100
|
#30
Exceptional
60.3%
Spanish American Indians
100.0
/100
|
#31
Exceptional
60.3%
Arapaho
100.0
/100
|
#32
Exceptional
60.2%
Immigrants | Mexico
100.0
/100
|
#33
Exceptional
60.2%
Spanish
100.0
/100
|
#34
Exceptional
60.2%
Immigrants | Philippines
100.0
/100
|
#35
Exceptional
60.1%
Chinese
100.0
/100
|
#36
Exceptional
60.1%
Irish
100.0
/100
|
#37
Exceptional
60.1%
Americans
100.0
/100
|
#38
Exceptional
60.0%
British
100.0
/100
|
#39
Exceptional
60.0%
Cherokee
100.0
/100
|
#40
Exceptional
59.9%
Northern Europeans
100.0
/100
|
#41
Exceptional
59.9%
Malaysians
100.0
/100
|
#42
Exceptional
59.8%

Demographics Similar to Immigrants from Netherlands by 2 or more Vehicles in Household

In terms of 2 or more vehicles in household, the demographic groups most similar to Immigrants from Netherlands are Immigrants from Canada (57.5%, a difference of 0.010%), Immigrants from Oceania (57.5%, a difference of 0.020%), Immigrants from Korea (57.6%, a difference of 0.030%), Immigrants from Bolivia (57.6%, a difference of 0.040%), and Jordanian (57.6%, a difference of 0.040%).
DemographicsRating | Rank2 or more Vehicles in Household
Fijians
98.4
/100
|
#100
Exceptional
57.6%
Lebanese
98.3
/100
|
#101
Exceptional
57.6%
Immigrants | Bolivia
98.2
/100
|
#102
Exceptional
57.6%
Jordanians
98.2
/100
|
#103
Exceptional
57.6%
Immigrants | Indonesia
98.2
/100
|
#104
Exceptional
57.6%
Immigrants | Korea
98.2
/100
|
#105
Exceptional
57.6%
Immigrants | Oceania
98.2
/100
|
#106
Exceptional
57.5%
Immigrants | Netherlands
98.2
/100
|
#107
Exceptional
57.5%
Immigrants | Canada
98.1
/100
|
#108
Exceptional
57.5%
Immigrants | North America
98.1
/100
|
#109
Exceptional
57.5%
Japanese
98.0
/100
|
#110
Exceptional
57.5%
Greeks
98.0
/100
|
#111
Exceptional
57.5%
Pueblo
98.0
/100
|
#112
Exceptional
57.5%
Zimbabweans
96.9
/100
|
#113
Exceptional
57.2%
Immigrants | Lebanon
96.8
/100
|
#114
Exceptional
57.2%