Immigrants from Latin America vs Immigrants from Hong Kong 2 or more Vehicles in Household
COMPARE
Immigrants from Latin America
Immigrants from Hong Kong
2 or more Vehicles in Household
2 or more Vehicles in Household Comparison
Immigrants from Latin America
Immigrants from Hong Kong
54.3%
2 OR MORE VEHICLES IN HOUSEHOLD
13.1/ 100
METRIC RATING
206th/ 347
METRIC RANK
52.6%
2 OR MORE VEHICLES IN HOUSEHOLD
0.6/ 100
METRIC RATING
257th/ 347
METRIC RANK
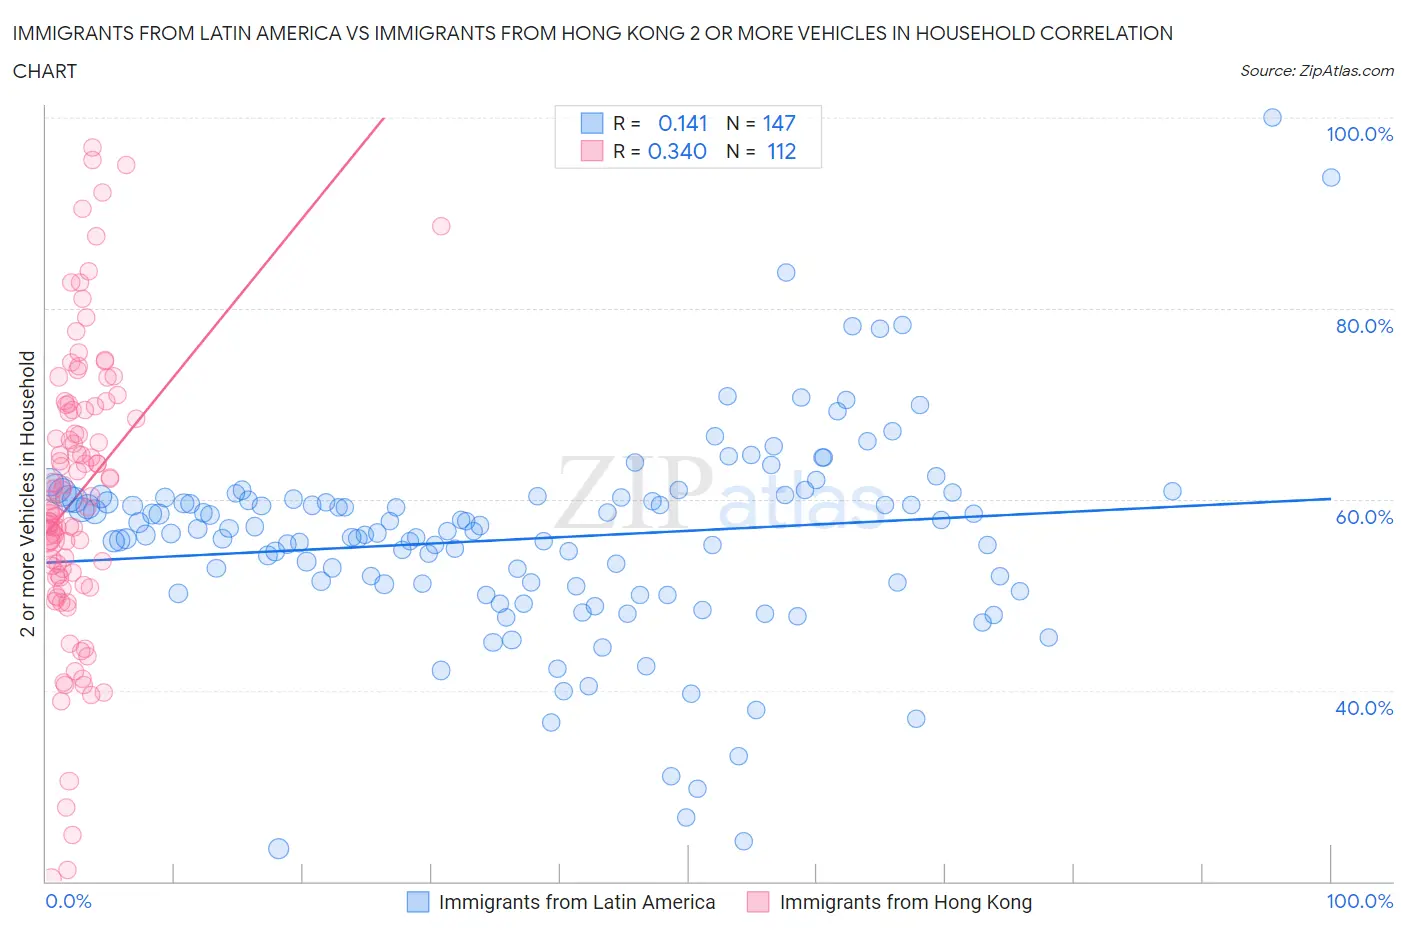
Immigrants from Latin America vs Immigrants from Hong Kong 2 or more Vehicles in Household Correlation Chart
The statistical analysis conducted on geographies consisting of 558,094,451 people shows a poor positive correlation between the proportion of Immigrants from Latin America and percentage of households with 2 or more vehicles available in the United States with a correlation coefficient (R) of 0.141 and weighted average of 54.3%. Similarly, the statistical analysis conducted on geographies consisting of 253,902,062 people shows a mild positive correlation between the proportion of Immigrants from Hong Kong and percentage of households with 2 or more vehicles available in the United States with a correlation coefficient (R) of 0.340 and weighted average of 52.6%, a difference of 3.3%.
2 or more Vehicles in Household Correlation Summary
| Measurement | Immigrants from Latin America | Immigrants from Hong Kong |
| Minimum | 23.4% | 20.2% |
| Maximum | 100.0% | 96.9% |
| Range | 76.6% | 76.6% |
| Mean | 55.9% | 60.4% |
| Median | 56.7% | 59.5% |
| Interquartile 25% (IQ1) | 51.1% | 52.0% |
| Interquartile 75% (IQ3) | 60.2% | 69.6% |
| Interquartile Range (IQR) | 9.1% | 17.6% |
| Standard Deviation (Sample) | 10.8% | 15.1% |
| Standard Deviation (Population) | 10.7% | 15.0% |
Similar Demographics by 2 or more Vehicles in Household
Demographics Similar to Immigrants from Latin America by 2 or more Vehicles in Household
In terms of 2 or more vehicles in household, the demographic groups most similar to Immigrants from Latin America are Turkish (54.3%, a difference of 0.010%), Cheyenne (54.3%, a difference of 0.050%), Immigrants from Belgium (54.3%, a difference of 0.060%), Egyptian (54.3%, a difference of 0.10%), and Immigrants from Bulgaria (54.3%, a difference of 0.10%).
| Demographics | Rating | Rank | 2 or more Vehicles in Household |
| Immigrants | Norway | 15.9 /100 | #199 | Poor 54.4% |
| Houma | 15.8 /100 | #200 | Poor 54.4% |
| Immigrants | Italy | 15.5 /100 | #201 | Poor 54.4% |
| Immigrants | North Macedonia | 14.9 /100 | #202 | Poor 54.4% |
| Immigrants | Peru | 14.3 /100 | #203 | Poor 54.4% |
| Immigrants | Belgium | 13.7 /100 | #204 | Poor 54.3% |
| Cheyenne | 13.6 /100 | #205 | Poor 54.3% |
| Immigrants | Latin America | 13.1 /100 | #206 | Poor 54.3% |
| Turks | 13.0 /100 | #207 | Poor 54.3% |
| Egyptians | 12.0 /100 | #208 | Poor 54.3% |
| Immigrants | Bulgaria | 12.0 /100 | #209 | Poor 54.3% |
| Immigrants | Saudi Arabia | 11.3 /100 | #210 | Poor 54.2% |
| Immigrants | Hungary | 11.3 /100 | #211 | Poor 54.2% |
| Immigrants | Chile | 11.1 /100 | #212 | Poor 54.2% |
| Guatemalans | 9.6 /100 | #213 | Tragic 54.1% |
Demographics Similar to Immigrants from Hong Kong by 2 or more Vehicles in Household
In terms of 2 or more vehicles in household, the demographic groups most similar to Immigrants from Hong Kong are Central American Indian (52.5%, a difference of 0.10%), Immigrants from Eritrea (52.6%, a difference of 0.14%), Alsatian (52.5%, a difference of 0.14%), Uruguayan (52.7%, a difference of 0.18%), and Immigrants from Bahamas (52.5%, a difference of 0.20%).
| Demographics | Rating | Rank | 2 or more Vehicles in Household |
| Mongolians | 1.0 /100 | #250 | Tragic 52.8% |
| Immigrants | Sudan | 1.0 /100 | #251 | Tragic 52.8% |
| Immigrants | Portugal | 1.0 /100 | #252 | Tragic 52.8% |
| Nigerians | 0.9 /100 | #253 | Tragic 52.8% |
| Immigrants | Malaysia | 0.8 /100 | #254 | Tragic 52.7% |
| Uruguayans | 0.7 /100 | #255 | Tragic 52.7% |
| Immigrants | Eritrea | 0.7 /100 | #256 | Tragic 52.6% |
| Immigrants | Hong Kong | 0.6 /100 | #257 | Tragic 52.6% |
| Central American Indians | 0.6 /100 | #258 | Tragic 52.5% |
| Alsatians | 0.6 /100 | #259 | Tragic 52.5% |
| Immigrants | Bahamas | 0.5 /100 | #260 | Tragic 52.5% |
| Immigrants | Australia | 0.5 /100 | #261 | Tragic 52.4% |
| Immigrants | Northern Africa | 0.4 /100 | #262 | Tragic 52.3% |
| Immigrants | Southern Europe | 0.4 /100 | #263 | Tragic 52.3% |
| Immigrants | Latvia | 0.4 /100 | #264 | Tragic 52.2% |