Immigrants from Eastern Africa vs Austrian 2 or more Vehicles in Household

COMPARE

Immigrants from Eastern Africa
Race
Ancestry
AfghanAfricanAlaska NativeAlaskan AthabascanAlbanianAleutAlsatianAmericanApacheArabArapahoArgentineanArmenianAssyrian/Chaldean/SyriacAustralianBahamianBangladeshiBarbadianBasqueBelgianBelizeanBermudanBhutaneseBlackfeetBolivianBrazilianBritishBritish West IndianBulgarianBurmeseCajunCambodianCanadianCape VerdeanCarpatho RusynCelticCentral AmericanCentral American IndianCherokeeCheyenneChickasawChileanChineseChippewaChoctawColombianColvilleComancheCosta RicanCreeCreekCroatianCrowCubanCypriotCzechCzechoslovakianDanishDelawareDominicanDutchDutch West IndianEastern EuropeanEcuadorianEgyptianEnglishEstonianEthiopianEuropeanFijianFilipinoFinnishFrenchFrench American IndianFrench CanadianGermanGerman RussianGhanaianGreekGuamanian/ChamorroGuatemalanGuyaneseHaitianHmongHonduranHopiHoumaHungarianIcelanderIndian (Asian)IndonesianInupiatIranianIraqiIrishIroquoisIsraeliItalianJamaicanJapaneseJordanianKenyanKiowaKoreanLaotianLatvianLebaneseLiberianLithuanianLumbeeLuxembourgerMacedonianMalaysianMalteseMarshalleseMenomineeMexicanMexican American IndianMongolianMoroccanNative HawaiianNavajoNepaleseNew ZealanderNicaraguanNigerianNorthern EuropeanNorwegianOkinawanOsageOttawaPaiutePakistaniPalestinianPanamanianParaguayanPennsylvania GermanPeruvianPimaPolishPortuguesePotawatomiPuebloPuerto RicanPuget Sound SalishRomanianRussianSalvadoranSamoanScandinavianScotch-IrishScottishSeminoleSenegaleseSerbianShoshoneSierra LeoneanSiouxSlavicSlovakSloveneSomaliSouth AfricanSouth AmericanSouth American IndianSoviet UnionSpaniardSpanishSpanish AmericanSpanish American IndianSri LankanSubsaharan AfricanSudaneseSwedishSwissSyrianTaiwaneseThaiTlingit-HaidaTohono O'OdhamTonganTrinidadian and TobagonianTsimshianTurkishU.S. Virgin IslanderUgandanUkrainianUruguayanUteVenezuelanVietnameseWelshWest IndianYakamaYaquiYugoslavianYumanYup'ikZimbabwean
Immigration
NonimmigrantsImmigrantsAfghanistanAfricaAlbaniaArgentinaArmeniaAsiaAustraliaAustriaBahamasBangladeshBarbadosBelarusBelgiumBelizeBoliviaBosnia and HerzegovinaBrazilBulgariaBurma/MyanmarCabo VerdeCambodiaCameroonCanadaCaribbeanCentral AmericaChileChinaColombiaCongoCosta RicaCroatiaCubaCzechoslovakiaDenmarkDominicaDominican RepublicEastern AfricaEastern AsiaEastern EuropeEcuadorEgyptEl SalvadorEnglandEritreaEthiopiaEuropeFijiFranceGermanyGhanaGreeceGrenadaGuatemalaGuyanaHaitiHondurasHong KongHungaryIndiaIndonesiaIranIraqIrelandIsraelItalyJamaicaJapanJordanKazakhstanKenyaKoreaKuwaitLaosLatin AmericaLatviaLebanonLiberiaLithuaniaMalaysiaMexicoMicronesiaMiddle AfricaMoldovaMoroccoNepalNetherlandsNicaraguaNigeriaNorth AmericaNorth MacedoniaNorthern AfricaNorthern EuropeNorwayOceaniaPakistanPanamaPeruPhilippinesPolandPortugalRomaniaRussiaSaudi ArabiaScotlandSenegalSerbiaSierra LeoneSingaporeSomaliaSouth AfricaSouth AmericaSouth Central AsiaSouth Eastern AsiaSouthern EuropeSpainSri LankaSt. Vincent and the GrenadinesSudanSwedenSwitzerlandSyriaTaiwanThailandTrinidad and TobagoTurkeyUgandaUkraineUruguayUzbekistanVenezuelaVietnamWest IndiesWestern AfricaWestern AsiaWestern EuropeYemenZaireZimbabweAzores
Austrian
Race
Ancestry
AfghanAfricanAlaska NativeAlaskan AthabascanAlbanianAleutAlsatianAmericanApacheArabArapahoArgentineanArmenianAssyrian/Chaldean/SyriacAustralianAustrianBahamianBangladeshiBarbadianBasqueBelgianBelizeanBermudanBhutaneseBlackfeetBolivianBrazilianBritishBritish West IndianBulgarianBurmeseCajunCambodianCanadianCape VerdeanCarpatho RusynCelticCentral AmericanCentral American IndianCherokeeCheyenneChickasawChileanChineseChippewaChoctawColombianColvilleComancheCosta RicanCreeCreekCroatianCrowCubanCypriotCzechCzechoslovakianDanishDelawareDominicanDutchDutch West IndianEastern EuropeanEcuadorianEgyptianEnglishEstonianEthiopianEuropeanFijianFilipinoFinnishFrenchFrench American IndianFrench CanadianGermanGerman RussianGhanaianGreekGuamanian/ChamorroGuatemalanGuyaneseHaitianHmongHonduranHopiHoumaHungarianIcelanderIndian (Asian)IndonesianInupiatIranianIraqiIrishIroquoisIsraeliItalianJamaicanJapaneseJordanianKenyanKiowaKoreanLaotianLatvianLebaneseLiberianLithuanianLumbeeLuxembourgerMacedonianMalaysianMalteseMarshalleseMenomineeMexicanMexican American IndianMongolianMoroccanNative HawaiianNavajoNepaleseNew ZealanderNicaraguanNigerianNorthern EuropeanNorwegianOkinawanOsageOttawaPaiutePakistaniPalestinianPanamanianParaguayanPennsylvania GermanPeruvianPimaPolishPortuguesePotawatomiPuebloPuerto RicanPuget Sound SalishRomanianRussianSalvadoranSamoanScandinavianScotch-IrishScottishSeminoleSenegaleseSerbianShoshoneSierra LeoneanSiouxSlavicSlovakSloveneSomaliSouth AfricanSouth AmericanSouth American IndianSoviet UnionSpaniardSpanishSpanish AmericanSpanish American IndianSri LankanSubsaharan AfricanSudaneseSwedishSwissSyrianTaiwaneseThaiTlingit-HaidaTohono O'OdhamTonganTrinidadian and TobagonianTsimshianTurkishU.S. Virgin IslanderUgandanUkrainianUruguayanUteVenezuelanVietnameseWelshWest IndianYakamaYaquiYugoslavianYumanYup'ikZimbabwean
Immigration
NonimmigrantsImmigrantsAfghanistanAfricaAlbaniaArgentinaArmeniaAsiaAustraliaAustriaBahamasBangladeshBarbadosBelarusBelgiumBelizeBoliviaBosnia and HerzegovinaBrazilBulgariaBurma/MyanmarCabo VerdeCambodiaCameroonCanadaCaribbeanCentral AmericaChileChinaColombiaCongoCosta RicaCroatiaCubaCzechoslovakiaDenmarkDominicaDominican RepublicEastern AsiaEastern EuropeEcuadorEgyptEl SalvadorEnglandEritreaEthiopiaEuropeFijiFranceGermanyGhanaGreeceGrenadaGuatemalaGuyanaHaitiHondurasHong KongHungaryIndiaIndonesiaIranIraqIrelandIsraelItalyJamaicaJapanJordanKazakhstanKenyaKoreaKuwaitLaosLatin AmericaLatviaLebanonLiberiaLithuaniaMalaysiaMexicoMicronesiaMiddle AfricaMoldovaMoroccoNepalNetherlandsNicaraguaNigeriaNorth AmericaNorth MacedoniaNorthern AfricaNorthern EuropeNorwayOceaniaPakistanPanamaPeruPhilippinesPolandPortugalRomaniaRussiaSaudi ArabiaScotlandSenegalSerbiaSierra LeoneSingaporeSomaliaSouth AfricaSouth AmericaSouth Central AsiaSouth Eastern AsiaSouthern EuropeSpainSri LankaSt. Vincent and the GrenadinesSudanSwedenSwitzerlandSyriaTaiwanThailandTrinidad and TobagoTurkeyUgandaUkraineUruguayUzbekistanVenezuelaVietnamWest IndiesWestern AfricaWestern AsiaWestern EuropeYemenZaireZimbabweAzores
2 or more Vehicles in Household
Income
Poverty
Unemployment
Labor Participation
Family Structure
Vehicle Availability
Education Level
Disability

2 or more Vehicles in Household Comparison

Immigrants from Eastern Africa

Austrians

Tragic
Exceptional
53.7%
2 OR MORE VEHICLES IN HOUSEHOLD
5.1/ 100
METRIC RATING
226th/ 347
METRIC RANK
58.4%
2 OR MORE VEHICLES IN HOUSEHOLD
99.6/ 100
METRIC RATING
72nd/ 347
METRIC RANK

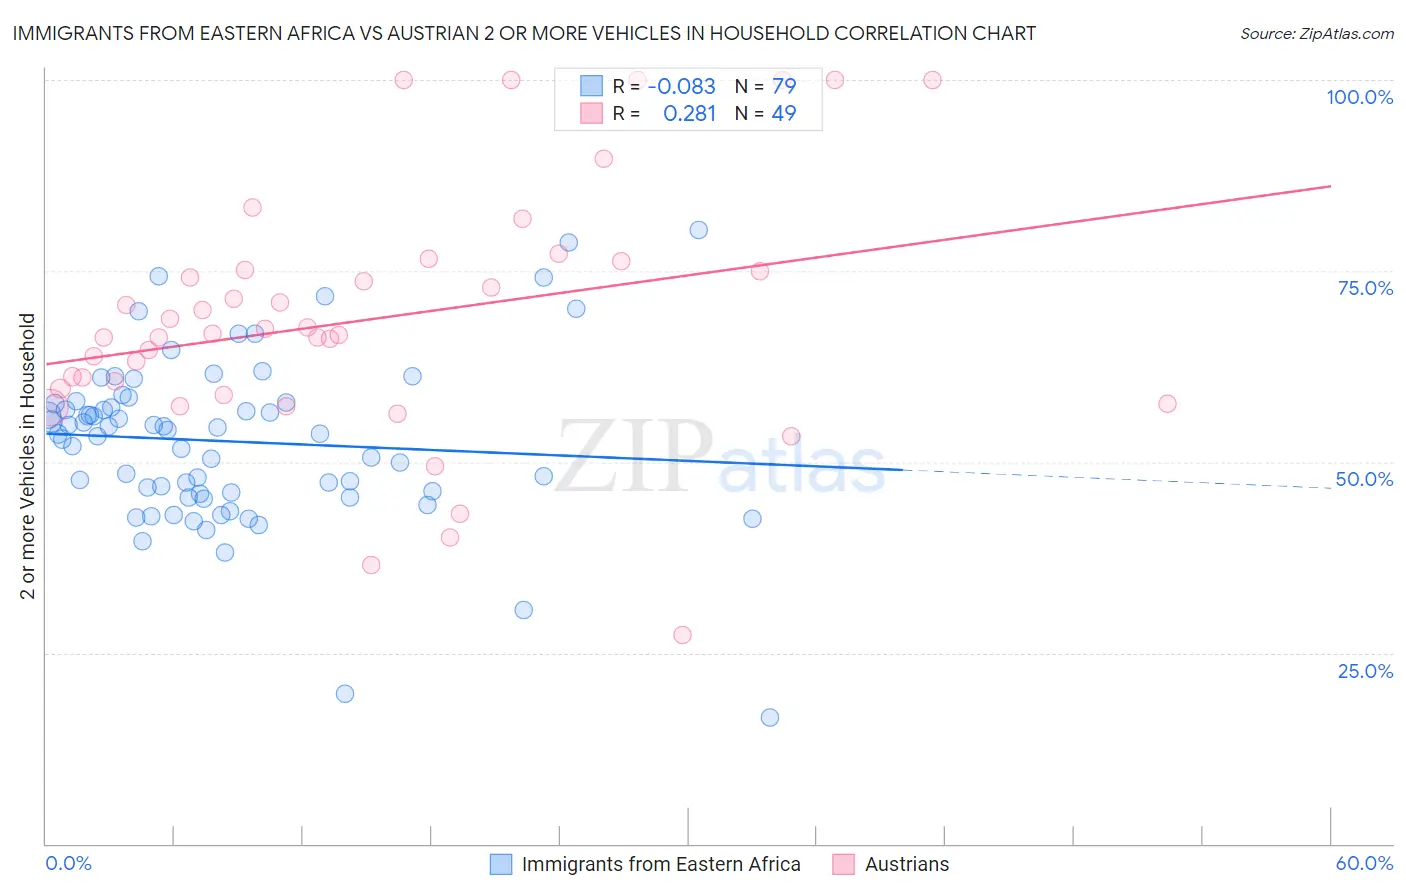
Immigrants from Eastern Africa vs Austrian 2 or more Vehicles in Household Correlation Chart

The statistical analysis conducted on geographies consisting of 354,928,878 people shows a slight negative correlation between the proportion of Immigrants from Eastern Africa and percentage of households with 2 or more vehicles available in the United States with a correlation coefficient (R) of -0.083 and weighted average of 53.7%. Similarly, the statistical analysis conducted on geographies consisting of 451,851,074 people shows a weak positive correlation between the proportion of Austrians and percentage of households with 2 or more vehicles available in the United States with a correlation coefficient (R) of 0.281 and weighted average of 58.4%, a difference of 8.7%.
Immigrants from Eastern Africa vs Austrian 2 or more Vehicles in Household

2 or more Vehicles in Household Correlation Summary

MeasurementImmigrants from Eastern AfricaAustrian
Minimum16.4%27.3%
Maximum80.4%100.0%
Range63.9%72.7%
Mean52.7%68.8%
Median53.7%66.8%
Interquartile 25% (IQ1)45.9%59.2%
Interquartile 75% (IQ3)57.8%75.7%
Interquartile Range (IQR)11.9%16.5%
Standard Deviation (Sample)11.1%16.5%
Standard Deviation (Population)11.0%16.3%

Similar Demographics by 2 or more Vehicles in Household

Demographics Similar to Immigrants from Eastern Africa by 2 or more Vehicles in Household

In terms of 2 or more vehicles in household, the demographic groups most similar to Immigrants from Eastern Africa are Immigrants from Egypt (53.8%, a difference of 0.020%), Brazilian (53.8%, a difference of 0.030%), Immigrants from Bosnia and Herzegovina (53.8%, a difference of 0.070%), Kiowa (53.9%, a difference of 0.20%), and Immigrants from Singapore (53.9%, a difference of 0.21%).
DemographicsRating | Rank2 or more Vehicles in Household
South American Indians
6.5
/100
|
#219
Tragic
53.9%
Taiwanese
6.3
/100
|
#220
Tragic
53.9%
Immigrants | Singapore
6.3
/100
|
#221
Tragic
53.9%
Kiowa
6.2
/100
|
#222
Tragic
53.9%
Immigrants | Bosnia and Herzegovina
5.5
/100
|
#223
Tragic
53.8%
Brazilians
5.3
/100
|
#224
Tragic
53.8%
Immigrants | Egypt
5.2
/100
|
#225
Tragic
53.8%
Immigrants | Eastern Africa
5.1
/100
|
#226
Tragic
53.7%
Sudanese
4.1
/100
|
#227
Tragic
53.6%
Alaska Natives
3.9
/100
|
#228
Tragic
53.6%
Immigrants | Turkey
3.8
/100
|
#229
Tragic
53.6%
Immigrants | Nepal
3.6
/100
|
#230
Tragic
53.5%
Panamanians
3.4
/100
|
#231
Tragic
53.5%
Immigrants | Guatemala
3.2
/100
|
#232
Tragic
53.5%
Ugandans
3.2
/100
|
#233
Tragic
53.5%

Demographics Similar to Austrians by 2 or more Vehicles in Household

In terms of 2 or more vehicles in household, the demographic groups most similar to Austrians are Bangladeshi (58.4%, a difference of 0.030%), Italian (58.4%, a difference of 0.050%), Bolivian (58.3%, a difference of 0.12%), Immigrants from Afghanistan (58.3%, a difference of 0.13%), and Pennsylvania German (58.5%, a difference of 0.16%).
DemographicsRating | Rank2 or more Vehicles in Household
Immigrants | Central America
99.7
/100
|
#65
Exceptional
58.6%
Croatians
99.7
/100
|
#66
Exceptional
58.6%
Laotians
99.7
/100
|
#67
Exceptional
58.6%
Canadians
99.7
/100
|
#68
Exceptional
58.6%
Pennsylvania Germans
99.7
/100
|
#69
Exceptional
58.5%
Italians
99.6
/100
|
#70
Exceptional
58.4%
Bangladeshis
99.6
/100
|
#71
Exceptional
58.4%
Austrians
99.6
/100
|
#72
Exceptional
58.4%
Bolivians
99.6
/100
|
#73
Exceptional
58.3%
Immigrants | Afghanistan
99.6
/100
|
#74
Exceptional
58.3%
Poles
99.5
/100
|
#75
Exceptional
58.3%
Creek
99.5
/100
|
#76
Exceptional
58.3%
Slovenes
99.5
/100
|
#77
Exceptional
58.3%
Lithuanians
99.5
/100
|
#78
Exceptional
58.2%
Delaware
99.4
/100
|
#79
Exceptional
58.2%