Hispanic or Latino vs Immigrants from Italy 2 or more Vehicles in Household

COMPARE

Hispanic or Latino
Race
Ancestry
AfghanAfricanAlaska NativeAlaskan AthabascanAlbanianAleutAlsatianAmericanApacheArabArapahoArgentineanArmenianAssyrian/Chaldean/SyriacAustralianAustrianBahamianBangladeshiBarbadianBasqueBelgianBelizeanBermudanBhutaneseBlackfeetBolivianBrazilianBritishBritish West IndianBulgarianBurmeseCajunCambodianCanadianCape VerdeanCarpatho RusynCelticCentral AmericanCentral American IndianCherokeeCheyenneChickasawChileanChineseChippewaChoctawColombianColvilleComancheCosta RicanCreeCreekCroatianCrowCubanCypriotCzechCzechoslovakianDanishDelawareDominicanDutchDutch West IndianEastern EuropeanEcuadorianEgyptianEnglishEstonianEthiopianEuropeanFijianFilipinoFinnishFrenchFrench American IndianFrench CanadianGermanGerman RussianGhanaianGreekGuamanian/ChamorroGuatemalanGuyaneseHaitianHmongHonduranHopiHoumaHungarianIcelanderIndian (Asian)IndonesianInupiatIranianIraqiIrishIroquoisIsraeliItalianJamaicanJapaneseJordanianKenyanKiowaKoreanLaotianLatvianLebaneseLiberianLithuanianLumbeeLuxembourgerMacedonianMalaysianMalteseMarshalleseMenomineeMexicanMexican American IndianMongolianMoroccanNative HawaiianNavajoNepaleseNew ZealanderNicaraguanNigerianNorthern EuropeanNorwegianOkinawanOsageOttawaPaiutePakistaniPalestinianPanamanianParaguayanPennsylvania GermanPeruvianPimaPolishPortuguesePotawatomiPuebloPuerto RicanPuget Sound SalishRomanianRussianSalvadoranSamoanScandinavianScotch-IrishScottishSeminoleSenegaleseSerbianShoshoneSierra LeoneanSiouxSlavicSlovakSloveneSomaliSouth AfricanSouth AmericanSouth American IndianSoviet UnionSpaniardSpanishSpanish AmericanSpanish American IndianSri LankanSubsaharan AfricanSudaneseSwedishSwissSyrianTaiwaneseThaiTlingit-HaidaTohono O'OdhamTonganTrinidadian and TobagonianTsimshianTurkishU.S. Virgin IslanderUgandanUkrainianUruguayanUteVenezuelanVietnameseWelshWest IndianYakamaYaquiYugoslavianYumanYup'ikZimbabwean
Immigration
NonimmigrantsImmigrantsAfghanistanAfricaAlbaniaArgentinaArmeniaAsiaAustraliaAustriaBahamasBangladeshBarbadosBelarusBelgiumBelizeBoliviaBosnia and HerzegovinaBrazilBulgariaBurma/MyanmarCabo VerdeCambodiaCameroonCanadaCaribbeanCentral AmericaChileChinaColombiaCongoCosta RicaCroatiaCubaCzechoslovakiaDenmarkDominicaDominican RepublicEastern AfricaEastern AsiaEastern EuropeEcuadorEgyptEl SalvadorEnglandEritreaEthiopiaEuropeFijiFranceGermanyGhanaGreeceGrenadaGuatemalaGuyanaHaitiHondurasHong KongHungaryIndiaIndonesiaIranIraqIrelandIsraelJamaicaJapanJordanKazakhstanKenyaKoreaKuwaitLaosLatin AmericaLatviaLebanonLiberiaLithuaniaMalaysiaMexicoMicronesiaMiddle AfricaMoldovaMoroccoNepalNetherlandsNicaraguaNigeriaNorth AmericaNorth MacedoniaNorthern AfricaNorthern EuropeNorwayOceaniaPakistanPanamaPeruPhilippinesPolandPortugalRomaniaRussiaSaudi ArabiaScotlandSenegalSerbiaSierra LeoneSingaporeSomaliaSouth AfricaSouth AmericaSouth Central AsiaSouth Eastern AsiaSouthern EuropeSpainSri LankaSt. Vincent and the GrenadinesSudanSwedenSwitzerlandSyriaTaiwanThailandTrinidad and TobagoTurkeyUgandaUkraineUruguayUzbekistanVenezuelaVietnamWest IndiesWestern AfricaWestern AsiaWestern EuropeYemenZaireZimbabweAzores
Immigrants from Italy
Race
Ancestry
AfghanAfricanAlaska NativeAlaskan AthabascanAlbanianAleutAlsatianAmericanApacheArabArapahoArgentineanArmenianAssyrian/Chaldean/SyriacAustralianAustrianBahamianBangladeshiBarbadianBasqueBelgianBelizeanBermudanBhutaneseBlackfeetBolivianBrazilianBritishBritish West IndianBulgarianBurmeseCajunCambodianCanadianCape VerdeanCarpatho RusynCelticCentral AmericanCentral American IndianCherokeeCheyenneChickasawChileanChineseChippewaChoctawColombianColvilleComancheCosta RicanCreeCreekCroatianCrowCubanCypriotCzechCzechoslovakianDanishDelawareDominicanDutchDutch West IndianEastern EuropeanEcuadorianEgyptianEnglishEstonianEthiopianEuropeanFijianFilipinoFinnishFrenchFrench American IndianFrench CanadianGermanGerman RussianGhanaianGreekGuamanian/ChamorroGuatemalanGuyaneseHaitianHmongHonduranHopiHoumaHungarianIcelanderIndian (Asian)IndonesianInupiatIranianIraqiIrishIroquoisIsraeliItalianJamaicanJapaneseJordanianKenyanKiowaKoreanLaotianLatvianLebaneseLiberianLithuanianLumbeeLuxembourgerMacedonianMalaysianMalteseMarshalleseMenomineeMexicanMexican American IndianMongolianMoroccanNative HawaiianNavajoNepaleseNew ZealanderNicaraguanNigerianNorthern EuropeanNorwegianOkinawanOsageOttawaPaiutePakistaniPalestinianPanamanianParaguayanPennsylvania GermanPeruvianPimaPolishPortuguesePotawatomiPuebloPuerto RicanPuget Sound SalishRomanianRussianSalvadoranSamoanScandinavianScotch-IrishScottishSeminoleSenegaleseSerbianShoshoneSierra LeoneanSiouxSlavicSlovakSloveneSomaliSouth AfricanSouth AmericanSouth American IndianSoviet UnionSpaniardSpanishSpanish AmericanSpanish American IndianSri LankanSubsaharan AfricanSudaneseSwedishSwissSyrianTaiwaneseThaiTlingit-HaidaTohono O'OdhamTonganTrinidadian and TobagonianTsimshianTurkishU.S. Virgin IslanderUgandanUkrainianUruguayanUteVenezuelanVietnameseWelshWest IndianYakamaYaquiYugoslavianYumanYup'ikZimbabwean
Immigration
NonimmigrantsImmigrantsAfghanistanAfricaAlbaniaArgentinaArmeniaAsiaAustraliaAustriaBahamasBangladeshBarbadosBelarusBelgiumBelizeBoliviaBosnia and HerzegovinaBrazilBulgariaBurma/MyanmarCabo VerdeCambodiaCameroonCanadaCaribbeanCentral AmericaChileChinaColombiaCongoCosta RicaCroatiaCubaCzechoslovakiaDenmarkDominicaDominican RepublicEastern AfricaEastern AsiaEastern EuropeEcuadorEgyptEl SalvadorEnglandEritreaEthiopiaEuropeFijiFranceGermanyGhanaGreeceGrenadaGuatemalaGuyanaHaitiHondurasHong KongHungaryIndiaIndonesiaIranIraqIrelandIsraelItalyJamaicaJapanJordanKazakhstanKenyaKoreaKuwaitLaosLatin AmericaLatviaLebanonLiberiaLithuaniaMalaysiaMexicoMicronesiaMiddle AfricaMoldovaMoroccoNepalNetherlandsNicaraguaNigeriaNorth AmericaNorth MacedoniaNorthern AfricaNorthern EuropeNorwayOceaniaPakistanPanamaPeruPhilippinesPolandPortugalRomaniaRussiaSaudi ArabiaScotlandSenegalSerbiaSierra LeoneSingaporeSomaliaSouth AfricaSouth AmericaSouth Central AsiaSouth Eastern AsiaSouthern EuropeSpainSri LankaSt. Vincent and the GrenadinesSudanSwedenSwitzerlandSyriaTaiwanThailandTrinidad and TobagoTurkeyUgandaUkraineUruguayUzbekistanVenezuelaVietnamWest IndiesWestern AfricaWestern AsiaWestern EuropeYemenZaireZimbabweAzores
2 or more Vehicles in Household
Income
Poverty
Unemployment
Labor Participation
Family Structure
Vehicle Availability
Education Level
Disability

2 or more Vehicles in Household Comparison

Hispanics or Latinos

Immigrants from Italy

Exceptional
Poor
57.9%
2 OR MORE VEHICLES IN HOUSEHOLD
99.0/ 100
METRIC RATING
90th/ 347
METRIC RANK
54.4%
2 OR MORE VEHICLES IN HOUSEHOLD
15.5/ 100
METRIC RATING
201st/ 347
METRIC RANK

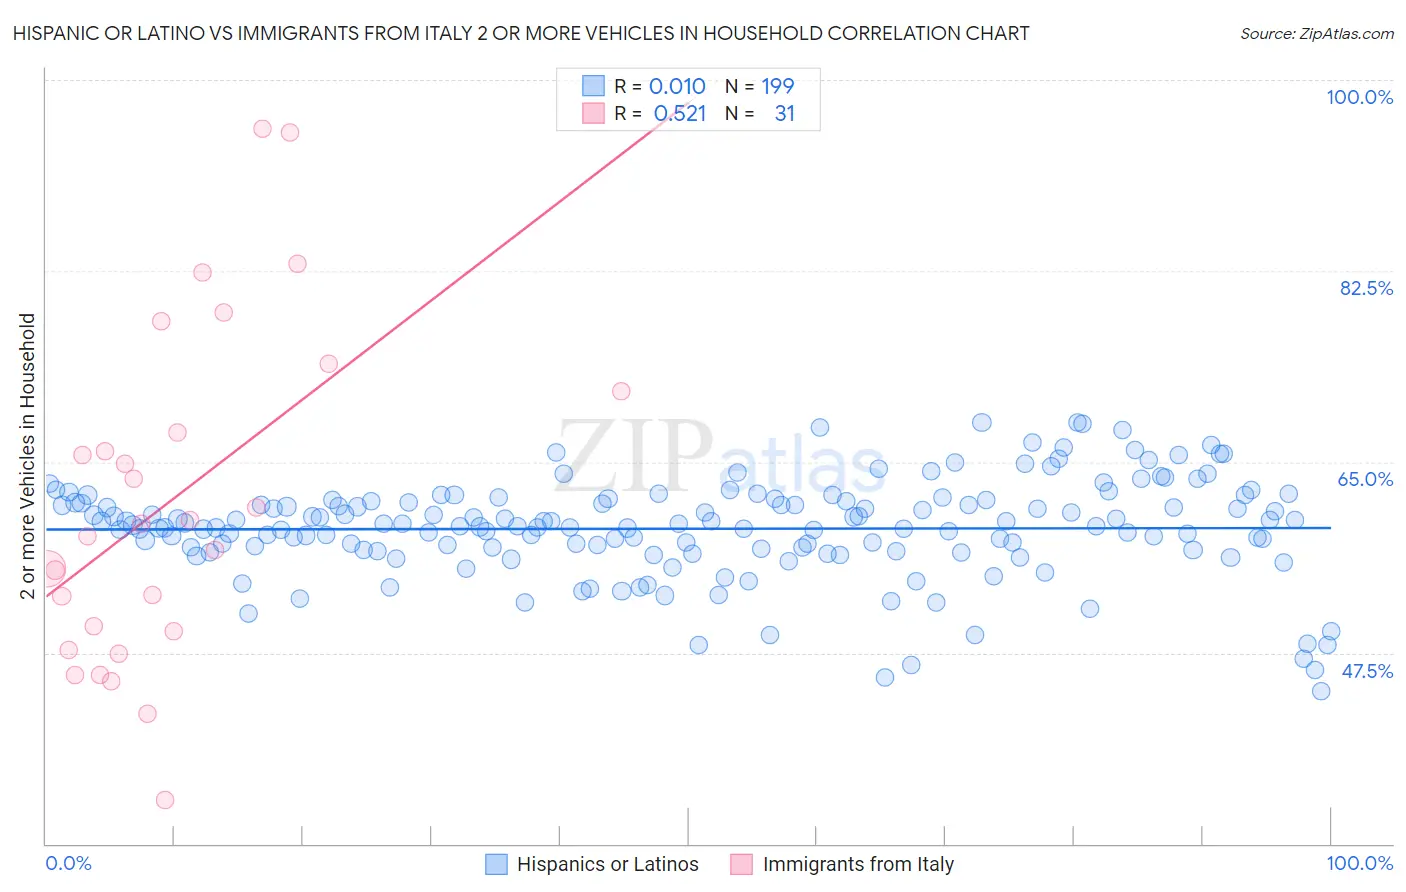
Hispanic or Latino vs Immigrants from Italy 2 or more Vehicles in Household Correlation Chart

The statistical analysis conducted on geographies consisting of 560,775,190 people shows no correlation between the proportion of Hispanics or Latinos and percentage of households with 2 or more vehicles available in the United States with a correlation coefficient (R) of 0.010 and weighted average of 57.9%. Similarly, the statistical analysis conducted on geographies consisting of 324,160,818 people shows a substantial positive correlation between the proportion of Immigrants from Italy and percentage of households with 2 or more vehicles available in the United States with a correlation coefficient (R) of 0.521 and weighted average of 54.4%, a difference of 6.4%.
Hispanic or Latino vs Immigrants from Italy 2 or more Vehicles in Household

2 or more Vehicles in Household Correlation Summary

MeasurementHispanic or LatinoImmigrants from Italy
Minimum44.0%34.1%
Maximum68.6%95.6%
Range24.6%61.5%
Mean58.9%61.4%
Median59.1%59.4%
Interquartile 25% (IQ1)56.9%49.4%
Interquartile 75% (IQ3)61.4%71.4%
Interquartile Range (IQR)4.5%22.0%
Standard Deviation (Sample)4.5%15.3%
Standard Deviation (Population)4.5%15.0%

Similar Demographics by 2 or more Vehicles in Household

Demographics Similar to Hispanics or Latinos by 2 or more Vehicles in Household

In terms of 2 or more vehicles in household, the demographic groups most similar to Hispanics or Latinos are Immigrants from Germany (57.9%, a difference of 0.0%), Pakistani (57.9%, a difference of 0.030%), Shoshone (57.9%, a difference of 0.050%), Ottawa (57.9%, a difference of 0.060%), and Immigrants from Iran (57.9%, a difference of 0.070%).
DemographicsRating | Rank2 or more Vehicles in Household
Icelanders
99.2
/100
|
#83
Exceptional
58.0%
Maltese
99.2
/100
|
#84
Exceptional
58.0%
Slovaks
99.2
/100
|
#85
Exceptional
58.0%
Potawatomi
99.1
/100
|
#86
Exceptional
58.0%
Thais
99.1
/100
|
#87
Exceptional
57.9%
Immigrants | Iran
99.1
/100
|
#88
Exceptional
57.9%
Immigrants | Germany
99.0
/100
|
#89
Exceptional
57.9%
Hispanics or Latinos
99.0
/100
|
#90
Exceptional
57.9%
Pakistanis
99.0
/100
|
#91
Exceptional
57.9%
Shoshone
99.0
/100
|
#92
Exceptional
57.9%
Ottawa
99.0
/100
|
#93
Exceptional
57.9%
Filipinos
98.9
/100
|
#94
Exceptional
57.8%
Hmong
98.9
/100
|
#95
Exceptional
57.8%
Burmese
98.8
/100
|
#96
Exceptional
57.8%
Slavs
98.8
/100
|
#97
Exceptional
57.8%

Demographics Similar to Immigrants from Italy by 2 or more Vehicles in Household

In terms of 2 or more vehicles in household, the demographic groups most similar to Immigrants from Italy are Immigrants from Norway (54.4%, a difference of 0.030%), Houma (54.4%, a difference of 0.030%), Immigrants from North Macedonia (54.4%, a difference of 0.050%), Carpatho Rusyn (54.4%, a difference of 0.060%), and Immigrants from Peru (54.4%, a difference of 0.090%).
DemographicsRating | Rank2 or more Vehicles in Household
Central Americans
23.0
/100
|
#194
Fair
54.7%
Iroquois
22.6
/100
|
#195
Fair
54.7%
Immigrants | Poland
19.3
/100
|
#196
Poor
54.6%
Argentineans
17.5
/100
|
#197
Poor
54.5%
Carpatho Rusyns
16.2
/100
|
#198
Poor
54.4%
Immigrants | Norway
15.9
/100
|
#199
Poor
54.4%
Houma
15.8
/100
|
#200
Poor
54.4%
Immigrants | Italy
15.5
/100
|
#201
Poor
54.4%
Immigrants | North Macedonia
14.9
/100
|
#202
Poor
54.4%
Immigrants | Peru
14.3
/100
|
#203
Poor
54.4%
Immigrants | Belgium
13.7
/100
|
#204
Poor
54.3%
Cheyenne
13.6
/100
|
#205
Poor
54.3%
Immigrants | Latin America
13.1
/100
|
#206
Poor
54.3%
Turks
13.0
/100
|
#207
Poor
54.3%
Egyptians
12.0
/100
|
#208
Poor
54.3%