Burmese vs Immigrants from Western Europe 3 or more Vehicles in Household
COMPARE
Burmese
Immigrants from Western Europe
3 or more Vehicles in Household
3 or more Vehicles in Household Comparison
Burmese
Immigrants from Western Europe
20.6%
3 OR MORE VEHICLES IN HOUSEHOLD
95.8/ 100
METRIC RATING
114th/ 347
METRIC RANK
19.5%
3 OR MORE VEHICLES IN HOUSEHOLD
53.2/ 100
METRIC RATING
171st/ 347
METRIC RANK
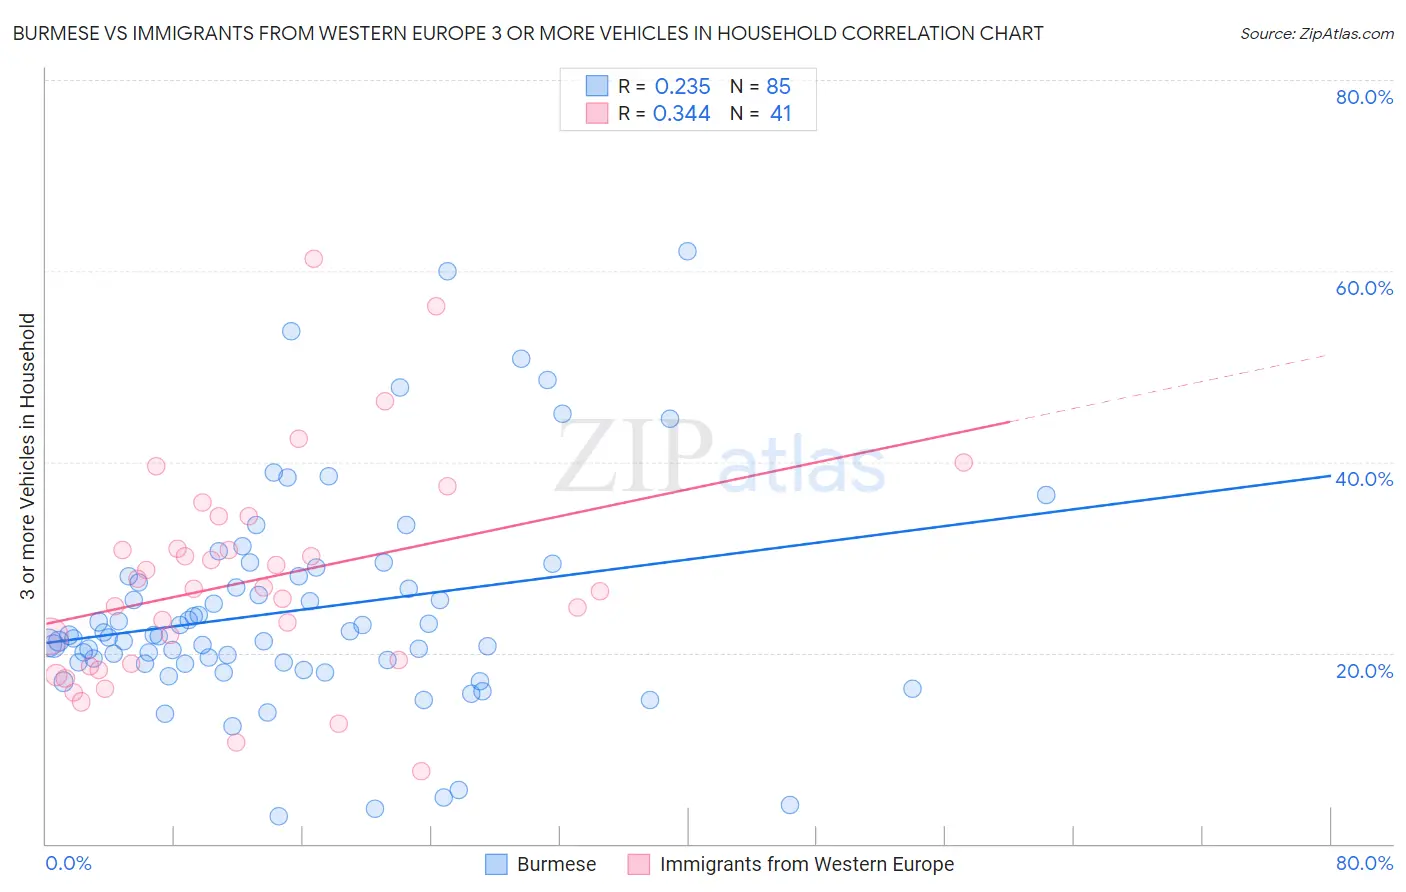
Burmese vs Immigrants from Western Europe 3 or more Vehicles in Household Correlation Chart
The statistical analysis conducted on geographies consisting of 464,700,639 people shows a weak positive correlation between the proportion of Burmese and percentage of households with 3 or more vehicles available in the United States with a correlation coefficient (R) of 0.235 and weighted average of 20.6%. Similarly, the statistical analysis conducted on geographies consisting of 493,637,379 people shows a mild positive correlation between the proportion of Immigrants from Western Europe and percentage of households with 3 or more vehicles available in the United States with a correlation coefficient (R) of 0.344 and weighted average of 19.5%, a difference of 5.6%.
3 or more Vehicles in Household Correlation Summary
| Measurement | Burmese | Immigrants from Western Europe |
| Minimum | 2.8% | 7.5% |
| Maximum | 62.0% | 61.3% |
| Range | 59.2% | 53.7% |
| Mean | 24.5% | 27.5% |
| Median | 21.7% | 26.7% |
| Interquartile 25% (IQ1) | 18.9% | 18.7% |
| Interquartile 75% (IQ3) | 28.0% | 32.6% |
| Interquartile Range (IQR) | 9.1% | 13.9% |
| Standard Deviation (Sample) | 11.4% | 11.3% |
| Standard Deviation (Population) | 11.3% | 11.2% |
Similar Demographics by 3 or more Vehicles in Household
Demographics Similar to Burmese by 3 or more Vehicles in Household
In terms of 3 or more vehicles in household, the demographic groups most similar to Burmese are Immigrants from England (20.7%, a difference of 0.18%), Nicaraguan (20.7%, a difference of 0.19%), French Canadian (20.6%, a difference of 0.31%), Italian (20.6%, a difference of 0.34%), and Croatian (20.6%, a difference of 0.36%).
| Demographics | Rating | Rank | 3 or more Vehicles in Household |
| Immigrants | Germany | 97.4 /100 | #107 | Exceptional 20.8% |
| Immigrants | Scotland | 97.1 /100 | #108 | Exceptional 20.8% |
| Filipinos | 97.0 /100 | #109 | Exceptional 20.8% |
| Asians | 96.8 /100 | #110 | Exceptional 20.8% |
| Immigrants | Micronesia | 96.7 /100 | #111 | Exceptional 20.7% |
| Nicaraguans | 96.2 /100 | #112 | Exceptional 20.7% |
| Immigrants | England | 96.2 /100 | #113 | Exceptional 20.7% |
| Burmese | 95.8 /100 | #114 | Exceptional 20.6% |
| French Canadians | 95.0 /100 | #115 | Exceptional 20.6% |
| Italians | 94.9 /100 | #116 | Exceptional 20.6% |
| Croatians | 94.9 /100 | #117 | Exceptional 20.6% |
| Costa Ricans | 94.6 /100 | #118 | Exceptional 20.6% |
| Immigrants | Latin America | 94.5 /100 | #119 | Exceptional 20.5% |
| Maltese | 93.9 /100 | #120 | Exceptional 20.5% |
| Immigrants | Thailand | 93.8 /100 | #121 | Exceptional 20.5% |
Demographics Similar to Immigrants from Western Europe by 3 or more Vehicles in Household
In terms of 3 or more vehicles in household, the demographic groups most similar to Immigrants from Western Europe are Kiowa (19.5%, a difference of 0.18%), Iraqi (19.6%, a difference of 0.21%), Immigrants from Northern Europe (19.5%, a difference of 0.23%), Immigrants from South Africa (19.5%, a difference of 0.24%), and Immigrants from Denmark (19.6%, a difference of 0.34%).
| Demographics | Rating | Rank | 3 or more Vehicles in Household |
| Yugoslavians | 62.9 /100 | #164 | Good 19.7% |
| Immigrants | Costa Rica | 61.9 /100 | #165 | Good 19.7% |
| Immigrants | Cameroon | 60.9 /100 | #166 | Good 19.7% |
| Ukrainians | 58.9 /100 | #167 | Average 19.6% |
| Peruvians | 58.8 /100 | #168 | Average 19.6% |
| Immigrants | Denmark | 57.6 /100 | #169 | Average 19.6% |
| Iraqis | 56.0 /100 | #170 | Average 19.6% |
| Immigrants | Western Europe | 53.2 /100 | #171 | Average 19.5% |
| Kiowa | 50.9 /100 | #172 | Average 19.5% |
| Immigrants | Northern Europe | 50.2 /100 | #173 | Average 19.5% |
| Immigrants | South Africa | 50.0 /100 | #174 | Average 19.5% |
| Syrians | 47.0 /100 | #175 | Average 19.5% |
| Iroquois | 46.0 /100 | #176 | Average 19.4% |
| Immigrants | Peru | 41.1 /100 | #177 | Average 19.4% |
| Immigrants | Syria | 40.3 /100 | #178 | Average 19.4% |