Brazilian vs Kenyan 1 or more Vehicles in Household

COMPARE

Brazilian
Race
Ancestry
AfghanAfricanAlaska NativeAlaskan AthabascanAlbanianAleutAlsatianAmericanApacheArabArapahoArgentineanArmenianAssyrian/Chaldean/SyriacAustralianAustrianBahamianBangladeshiBarbadianBasqueBelgianBelizeanBermudanBhutaneseBlackfeetBolivianBrazilianBritishBritish West IndianBulgarianBurmeseCajunCambodianCanadianCape VerdeanCarpatho RusynCelticCentral AmericanCentral American IndianCherokeeCheyenneChickasawChileanChineseChippewaChoctawColombianColvilleComancheCosta RicanCreeCreekCroatianCrowCubanCypriotCzechCzechoslovakianDanishDelawareDominicanDutchDutch West IndianEastern EuropeanEcuadorianEgyptianEnglishEstonianEthiopianEuropeanFijianFilipinoFinnishFrenchFrench American IndianFrench CanadianGermanGerman RussianGhanaianGreekGuamanian/ChamorroGuatemalanGuyaneseHaitianHmongHonduranHopiHoumaHungarianIcelanderIndian (Asian)IndonesianInupiatIranianIraqiIrishIroquoisIsraeliItalianJamaicanJapaneseJordanianKiowaKoreanLaotianLatvianLebaneseLiberianLithuanianLumbeeLuxembourgerMacedonianMalaysianMalteseMarshalleseMenomineeMexicanMexican American IndianMongolianMoroccanNative HawaiianNavajoNepaleseNew ZealanderNicaraguanNigerianNorthern EuropeanNorwegianOkinawanOsageOttawaPaiutePakistaniPalestinianPanamanianParaguayanPennsylvania GermanPeruvianPimaPolishPortuguesePotawatomiPuebloPuerto RicanPuget Sound SalishRomanianRussianSalvadoranSamoanScandinavianScotch-IrishScottishSeminoleSenegaleseSerbianShoshoneSierra LeoneanSiouxSlavicSlovakSloveneSomaliSouth AfricanSouth AmericanSouth American IndianSoviet UnionSpaniardSpanishSpanish AmericanSpanish American IndianSri LankanSubsaharan AfricanSudaneseSwedishSwissSyrianTaiwaneseThaiTlingit-HaidaTohono O'OdhamTonganTrinidadian and TobagonianTsimshianTurkishU.S. Virgin IslanderUgandanUkrainianUruguayanUteVenezuelanVietnameseWelshWest IndianYakamaYaquiYugoslavianYumanYup'ikZimbabwean
Immigration
NonimmigrantsImmigrantsAfghanistanAfricaAlbaniaArgentinaArmeniaAsiaAustraliaAustriaBahamasBangladeshBarbadosBelarusBelgiumBelizeBoliviaBosnia and HerzegovinaBrazilBulgariaBurma/MyanmarCabo VerdeCambodiaCameroonCanadaCaribbeanCentral AmericaChileChinaColombiaCongoCosta RicaCroatiaCubaCzechoslovakiaDenmarkDominicaDominican RepublicEastern AfricaEastern AsiaEastern EuropeEcuadorEgyptEl SalvadorEnglandEritreaEthiopiaEuropeFijiFranceGermanyGhanaGreeceGrenadaGuatemalaGuyanaHaitiHondurasHong KongHungaryIndiaIndonesiaIranIraqIrelandIsraelItalyJamaicaJapanJordanKazakhstanKenyaKoreaKuwaitLaosLatin AmericaLatviaLebanonLiberiaLithuaniaMalaysiaMexicoMicronesiaMiddle AfricaMoldovaMoroccoNepalNetherlandsNicaraguaNigeriaNorth AmericaNorth MacedoniaNorthern AfricaNorthern EuropeNorwayOceaniaPakistanPanamaPeruPhilippinesPolandPortugalRomaniaRussiaSaudi ArabiaScotlandSenegalSerbiaSierra LeoneSingaporeSomaliaSouth AfricaSouth AmericaSouth Central AsiaSouth Eastern AsiaSouthern EuropeSpainSri LankaSt. Vincent and the GrenadinesSudanSwedenSwitzerlandSyriaTaiwanThailandTrinidad and TobagoTurkeyUgandaUkraineUruguayUzbekistanVenezuelaVietnamWest IndiesWestern AfricaWestern AsiaWestern EuropeYemenZaireZimbabweAzores
Kenyan
Race
Ancestry
AfghanAfricanAlaska NativeAlaskan AthabascanAlbanianAleutAlsatianAmericanApacheArabArapahoArgentineanArmenianAssyrian/Chaldean/SyriacAustralianAustrianBahamianBangladeshiBarbadianBasqueBelgianBelizeanBermudanBhutaneseBlackfeetBolivianBritishBritish West IndianBulgarianBurmeseCajunCambodianCanadianCape VerdeanCarpatho RusynCelticCentral AmericanCentral American IndianCherokeeCheyenneChickasawChileanChineseChippewaChoctawColombianColvilleComancheCosta RicanCreeCreekCroatianCrowCubanCypriotCzechCzechoslovakianDanishDelawareDominicanDutchDutch West IndianEastern EuropeanEcuadorianEgyptianEnglishEstonianEthiopianEuropeanFijianFilipinoFinnishFrenchFrench American IndianFrench CanadianGermanGerman RussianGhanaianGreekGuamanian/ChamorroGuatemalanGuyaneseHaitianHmongHonduranHopiHoumaHungarianIcelanderIndian (Asian)IndonesianInupiatIranianIraqiIrishIroquoisIsraeliItalianJamaicanJapaneseJordanianKenyanKiowaKoreanLaotianLatvianLebaneseLiberianLithuanianLumbeeLuxembourgerMacedonianMalaysianMalteseMarshalleseMenomineeMexicanMexican American IndianMongolianMoroccanNative HawaiianNavajoNepaleseNew ZealanderNicaraguanNigerianNorthern EuropeanNorwegianOkinawanOsageOttawaPaiutePakistaniPalestinianPanamanianParaguayanPennsylvania GermanPeruvianPimaPolishPortuguesePotawatomiPuebloPuerto RicanPuget Sound SalishRomanianRussianSalvadoranSamoanScandinavianScotch-IrishScottishSeminoleSenegaleseSerbianShoshoneSierra LeoneanSiouxSlavicSlovakSloveneSomaliSouth AfricanSouth AmericanSouth American IndianSoviet UnionSpaniardSpanishSpanish AmericanSpanish American IndianSri LankanSubsaharan AfricanSudaneseSwedishSwissSyrianTaiwaneseThaiTlingit-HaidaTohono O'OdhamTonganTrinidadian and TobagonianTsimshianTurkishU.S. Virgin IslanderUgandanUkrainianUruguayanUteVenezuelanVietnameseWelshWest IndianYakamaYaquiYugoslavianYumanYup'ikZimbabwean
Immigration
NonimmigrantsImmigrantsAfghanistanAfricaAlbaniaArgentinaArmeniaAsiaAustraliaAustriaBahamasBangladeshBarbadosBelarusBelgiumBelizeBoliviaBosnia and HerzegovinaBrazilBulgariaBurma/MyanmarCabo VerdeCambodiaCameroonCanadaCaribbeanCentral AmericaChileChinaColombiaCongoCosta RicaCroatiaCubaCzechoslovakiaDenmarkDominicaDominican RepublicEastern AfricaEastern AsiaEastern EuropeEcuadorEgyptEl SalvadorEnglandEritreaEthiopiaEuropeFijiFranceGermanyGhanaGreeceGrenadaGuatemalaGuyanaHaitiHondurasHong KongHungaryIndiaIndonesiaIranIraqIrelandIsraelItalyJamaicaJapanJordanKazakhstanKenyaKoreaKuwaitLaosLatin AmericaLatviaLebanonLiberiaLithuaniaMalaysiaMexicoMicronesiaMiddle AfricaMoldovaMoroccoNepalNetherlandsNicaraguaNigeriaNorth AmericaNorth MacedoniaNorthern AfricaNorthern EuropeNorwayOceaniaPakistanPanamaPeruPhilippinesPolandPortugalRomaniaRussiaSaudi ArabiaScotlandSenegalSerbiaSierra LeoneSingaporeSomaliaSouth AfricaSouth AmericaSouth Central AsiaSouth Eastern AsiaSouthern EuropeSpainSri LankaSt. Vincent and the GrenadinesSudanSwedenSwitzerlandSyriaTaiwanThailandTrinidad and TobagoTurkeyUgandaUkraineUruguayUzbekistanVenezuelaVietnamWest IndiesWestern AfricaWestern AsiaWestern EuropeYemenZaireZimbabweAzores
1 or more Vehicles in Household
Income
Poverty
Unemployment
Labor Participation
Family Structure
Vehicle Availability
Education Level
Disability

1 or more Vehicles in Household Comparison

Brazilians

Kenyans

Good
Excellent
90.0%
1 OR MORE VEHICLES IN HOUSEHOLD
71.0/ 100
METRIC RATING
158th/ 347
METRIC RANK
90.4%
1 OR MORE VEHICLES IN HOUSEHOLD
87.0/ 100
METRIC RATING
134th/ 347
METRIC RANK

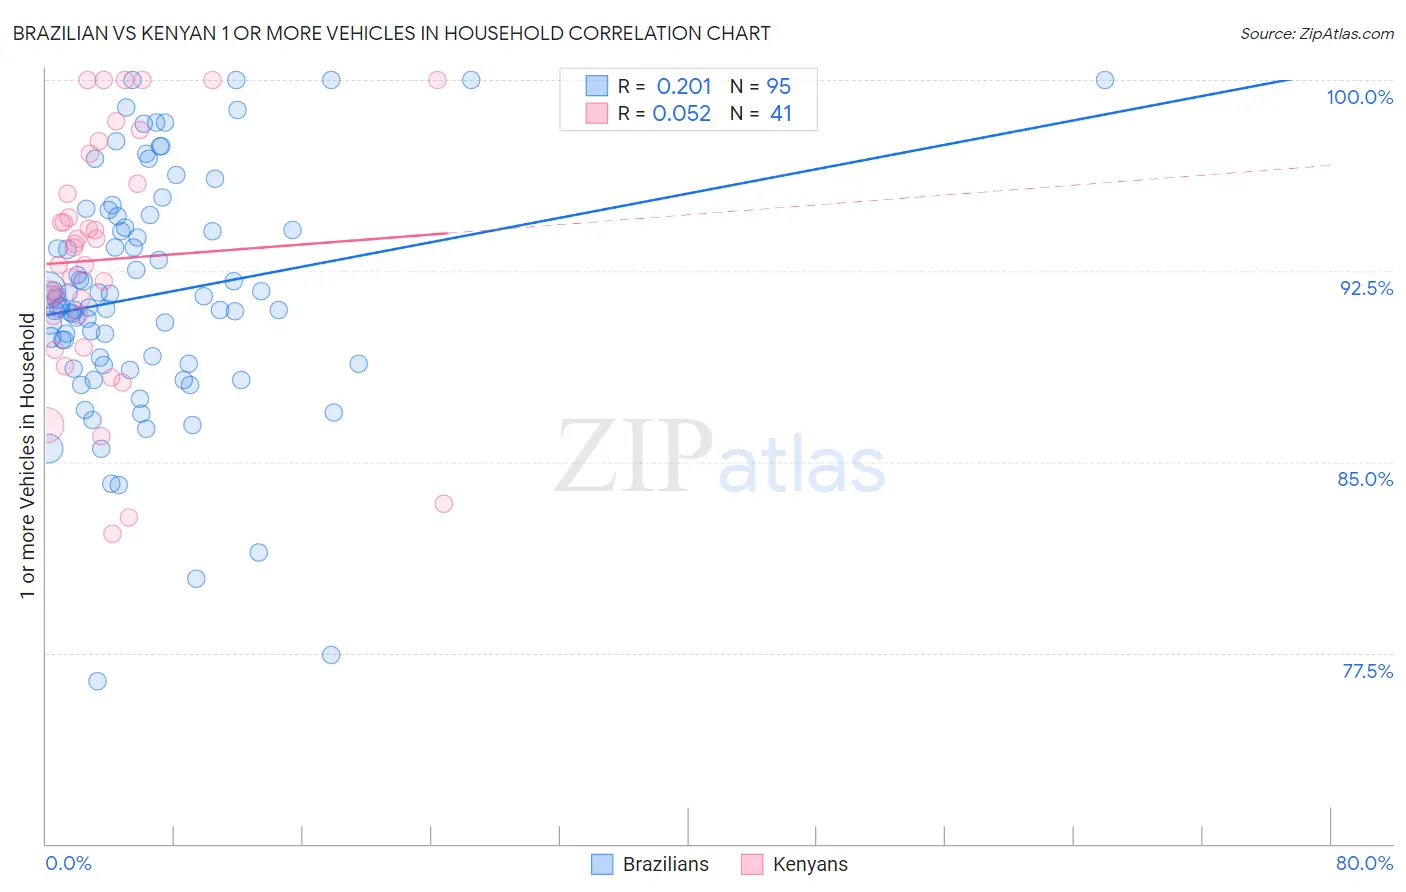
Brazilian vs Kenyan 1 or more Vehicles in Household Correlation Chart

The statistical analysis conducted on geographies consisting of 323,363,062 people shows a weak positive correlation between the proportion of Brazilians and percentage of households with 1 or more vehicles available in the United States with a correlation coefficient (R) of 0.201 and weighted average of 90.0%. Similarly, the statistical analysis conducted on geographies consisting of 168,180,305 people shows a slight positive correlation between the proportion of Kenyans and percentage of households with 1 or more vehicles available in the United States with a correlation coefficient (R) of 0.052 and weighted average of 90.4%, a difference of 0.39%.
Brazilian vs Kenyan 1 or more Vehicles in Household

1 or more Vehicles in Household Correlation Summary

MeasurementBrazilianKenyan
Minimum76.4%82.2%
Maximum100.0%100.0%
Range23.6%17.8%
Mean91.5%93.0%
Median91.1%93.4%
Interquartile 25% (IQ1)88.8%90.1%
Interquartile 75% (IQ3)94.6%96.5%
Interquartile Range (IQR)5.8%6.4%
Standard Deviation (Sample)4.7%4.8%
Standard Deviation (Population)4.7%4.8%

Similar Demographics by 1 or more Vehicles in Household

Demographics Similar to Brazilians by 1 or more Vehicles in Household

In terms of 1 or more vehicles in household, the demographic groups most similar to Brazilians are Immigrants from Congo (90.0%, a difference of 0.0%), South African (90.0%, a difference of 0.020%), Australian (90.0%, a difference of 0.030%), Immigrants from Indonesia (90.0%, a difference of 0.040%), and Salvadoran (90.0%, a difference of 0.040%).
DemographicsRating | Rank1 or more Vehicles in Household
Immigrants | Bosnia and Herzegovina
75.4
/100
|
#151
Good
90.1%
Tlingit-Haida
74.3
/100
|
#152
Good
90.1%
New Zealanders
73.8
/100
|
#153
Good
90.1%
Immigrants | Uganda
73.8
/100
|
#154
Good
90.1%
Immigrants | Immigrants
73.6
/100
|
#155
Good
90.1%
Australians
72.4
/100
|
#156
Good
90.0%
Immigrants | Congo
71.2
/100
|
#157
Good
90.0%
Brazilians
71.0
/100
|
#158
Good
90.0%
South Africans
69.7
/100
|
#159
Good
90.0%
Immigrants | Indonesia
68.8
/100
|
#160
Good
90.0%
Salvadorans
68.7
/100
|
#161
Good
90.0%
Spanish American Indians
67.0
/100
|
#162
Good
89.9%
Immigrants | Austria
65.5
/100
|
#163
Good
89.9%
Comanche
63.4
/100
|
#164
Good
89.9%
Immigrants | Saudi Arabia
62.6
/100
|
#165
Good
89.9%

Demographics Similar to Kenyans by 1 or more Vehicles in Household

In terms of 1 or more vehicles in household, the demographic groups most similar to Kenyans are Immigrants from Oceania (90.4%, a difference of 0.0%), Immigrants from Syria (90.4%, a difference of 0.020%), Hungarian (90.3%, a difference of 0.020%), Latvian (90.3%, a difference of 0.020%), and Syrian (90.3%, a difference of 0.020%).
DemographicsRating | Rank1 or more Vehicles in Household
Immigrants | Azores
89.1
/100
|
#127
Excellent
90.4%
Burmese
89.0
/100
|
#128
Excellent
90.4%
Marshallese
88.9
/100
|
#129
Excellent
90.4%
Nicaraguans
88.8
/100
|
#130
Excellent
90.4%
Immigrants | Kenya
88.5
/100
|
#131
Excellent
90.4%
Immigrants | South Africa
88.1
/100
|
#132
Excellent
90.4%
Immigrants | Syria
87.5
/100
|
#133
Excellent
90.4%
Kenyans
87.0
/100
|
#134
Excellent
90.4%
Immigrants | Oceania
86.9
/100
|
#135
Excellent
90.4%
Hungarians
86.5
/100
|
#136
Excellent
90.3%
Latvians
86.3
/100
|
#137
Excellent
90.3%
Syrians
86.3
/100
|
#138
Excellent
90.3%
Estonians
85.6
/100
|
#139
Excellent
90.3%
Sudanese
85.2
/100
|
#140
Excellent
90.3%
Immigrants | Moldova
83.1
/100
|
#141
Excellent
90.2%