Alsatian vs Immigrants from Israel 4 or more Vehicles in Household

COMPARE

Alsatian
Race
Ancestry
AfghanAfricanAlaska NativeAlaskan AthabascanAlbanianAleutAlsatianAmericanApacheArabArapahoArgentineanArmenianAssyrian/Chaldean/SyriacAustralianAustrianBahamianBangladeshiBarbadianBasqueBelgianBelizeanBermudanBhutaneseBlackfeetBolivianBrazilianBritishBritish West IndianBulgarianBurmeseCajunCambodianCanadianCape VerdeanCarpatho RusynCelticCentral AmericanCentral American IndianCherokeeCheyenneChickasawChileanChineseChippewaChoctawColombianColvilleComancheCosta RicanCreeCreekCroatianCrowCubanCypriotCzechCzechoslovakianDanishDelawareDominicanDutchDutch West IndianEastern EuropeanEcuadorianEgyptianEnglishEstonianEthiopianEuropeanFijianFilipinoFinnishFrenchFrench American IndianFrench CanadianGermanGerman RussianGhanaianGreekGuamanian/ChamorroGuatemalanGuyaneseHaitianHmongHonduranHopiHoumaHungarianIcelanderIndian (Asian)IndonesianInupiatIranianIraqiIrishIroquoisIsraeliItalianJamaicanJapaneseJordanianKenyanKiowaKoreanLaotianLatvianLebaneseLiberianLithuanianLumbeeLuxembourgerMacedonianMalaysianMalteseMarshalleseMenomineeMexicanMexican American IndianMongolianMoroccanNative HawaiianNavajoNepaleseNew ZealanderNicaraguanNigerianNorthern EuropeanNorwegianOkinawanOsageOttawaPaiutePakistaniPalestinianPanamanianParaguayanPennsylvania GermanPeruvianPimaPolishPortuguesePotawatomiPuebloPuerto RicanPuget Sound SalishRomanianRussianSalvadoranSamoanScandinavianScotch-IrishScottishSeminoleSenegaleseSerbianShoshoneSierra LeoneanSiouxSlavicSlovakSloveneSomaliSouth AfricanSouth AmericanSouth American IndianSoviet UnionSpaniardSpanishSpanish AmericanSpanish American IndianSri LankanSubsaharan AfricanSudaneseSwedishSwissSyrianTaiwaneseThaiTlingit-HaidaTohono O'OdhamTonganTrinidadian and TobagonianTsimshianTurkishU.S. Virgin IslanderUgandanUkrainianUruguayanUteVenezuelanVietnameseWelshWest IndianYakamaYaquiYugoslavianYumanYup'ikZimbabwean
Immigration
NonimmigrantsImmigrantsAfghanistanAfricaAlbaniaArgentinaArmeniaAsiaAustraliaAustriaBahamasBangladeshBarbadosBelarusBelgiumBelizeBoliviaBosnia and HerzegovinaBrazilBulgariaBurma/MyanmarCabo VerdeCambodiaCameroonCanadaCaribbeanCentral AmericaChileChinaColombiaCongoCosta RicaCroatiaCubaCzechoslovakiaDenmarkDominicaDominican RepublicEastern AfricaEastern AsiaEastern EuropeEcuadorEgyptEl SalvadorEnglandEritreaEthiopiaEuropeFijiFranceGermanyGhanaGreeceGrenadaGuatemalaGuyanaHaitiHondurasHong KongHungaryIndiaIndonesiaIranIraqIrelandItalyJamaicaJapanJordanKazakhstanKenyaKoreaKuwaitLaosLatin AmericaLatviaLebanonLiberiaLithuaniaMalaysiaMexicoMicronesiaMiddle AfricaMoldovaMoroccoNepalNetherlandsNicaraguaNigeriaNorth AmericaNorth MacedoniaNorthern AfricaNorthern EuropeNorwayOceaniaPakistanPanamaPeruPhilippinesPolandPortugalRomaniaRussiaSaudi ArabiaScotlandSenegalSerbiaSierra LeoneSingaporeSomaliaSouth AfricaSouth AmericaSouth Central AsiaSouth Eastern AsiaSouthern EuropeSpainSri LankaSt. Vincent and the GrenadinesSudanSwedenSwitzerlandSyriaTaiwanThailandTrinidad and TobagoTurkeyUgandaUkraineUruguayUzbekistanVenezuelaVietnamWest IndiesWestern AfricaWestern AsiaWestern EuropeYemenZaireZimbabweAzores
Immigrants from Israel
Race
Ancestry
AfghanAfricanAlaska NativeAlaskan AthabascanAlbanianAleutAmericanApacheArabArapahoArgentineanArmenianAssyrian/Chaldean/SyriacAustralianAustrianBahamianBangladeshiBarbadianBasqueBelgianBelizeanBermudanBhutaneseBlackfeetBolivianBrazilianBritishBritish West IndianBulgarianBurmeseCajunCambodianCanadianCape VerdeanCarpatho RusynCelticCentral AmericanCentral American IndianCherokeeCheyenneChickasawChileanChineseChippewaChoctawColombianColvilleComancheCosta RicanCreeCreekCroatianCrowCubanCypriotCzechCzechoslovakianDanishDelawareDominicanDutchDutch West IndianEastern EuropeanEcuadorianEgyptianEnglishEstonianEthiopianEuropeanFijianFilipinoFinnishFrenchFrench American IndianFrench CanadianGermanGerman RussianGhanaianGreekGuamanian/ChamorroGuatemalanGuyaneseHaitianHmongHonduranHopiHoumaHungarianIcelanderIndian (Asian)IndonesianInupiatIranianIraqiIrishIroquoisIsraeliItalianJamaicanJapaneseJordanianKenyanKiowaKoreanLaotianLatvianLebaneseLiberianLithuanianLumbeeLuxembourgerMacedonianMalaysianMalteseMarshalleseMenomineeMexicanMexican American IndianMongolianMoroccanNative HawaiianNavajoNepaleseNew ZealanderNicaraguanNigerianNorthern EuropeanNorwegianOkinawanOsageOttawaPaiutePakistaniPalestinianPanamanianParaguayanPennsylvania GermanPeruvianPimaPolishPortuguesePotawatomiPuebloPuerto RicanPuget Sound SalishRomanianRussianSalvadoranSamoanScandinavianScotch-IrishScottishSeminoleSenegaleseSerbianShoshoneSierra LeoneanSiouxSlavicSlovakSloveneSomaliSouth AfricanSouth AmericanSouth American IndianSoviet UnionSpaniardSpanishSpanish AmericanSpanish American IndianSri LankanSubsaharan AfricanSudaneseSwedishSwissSyrianTaiwaneseThaiTlingit-HaidaTohono O'OdhamTonganTrinidadian and TobagonianTsimshianTurkishU.S. Virgin IslanderUgandanUkrainianUruguayanUteVenezuelanVietnameseWelshWest IndianYakamaYaquiYugoslavianYumanYup'ikZimbabwean
Immigration
NonimmigrantsImmigrantsAfghanistanAfricaAlbaniaArgentinaArmeniaAsiaAustraliaAustriaBahamasBangladeshBarbadosBelarusBelgiumBelizeBoliviaBosnia and HerzegovinaBrazilBulgariaBurma/MyanmarCabo VerdeCambodiaCameroonCanadaCaribbeanCentral AmericaChileChinaColombiaCongoCosta RicaCroatiaCubaCzechoslovakiaDenmarkDominicaDominican RepublicEastern AfricaEastern AsiaEastern EuropeEcuadorEgyptEl SalvadorEnglandEritreaEthiopiaEuropeFijiFranceGermanyGhanaGreeceGrenadaGuatemalaGuyanaHaitiHondurasHong KongHungaryIndiaIndonesiaIranIraqIrelandIsraelItalyJamaicaJapanJordanKazakhstanKenyaKoreaKuwaitLaosLatin AmericaLatviaLebanonLiberiaLithuaniaMalaysiaMexicoMicronesiaMiddle AfricaMoldovaMoroccoNepalNetherlandsNicaraguaNigeriaNorth AmericaNorth MacedoniaNorthern AfricaNorthern EuropeNorwayOceaniaPakistanPanamaPeruPhilippinesPolandPortugalRomaniaRussiaSaudi ArabiaScotlandSenegalSerbiaSierra LeoneSingaporeSomaliaSouth AfricaSouth AmericaSouth Central AsiaSouth Eastern AsiaSouthern EuropeSpainSri LankaSt. Vincent and the GrenadinesSudanSwedenSwitzerlandSyriaTaiwanThailandTrinidad and TobagoTurkeyUgandaUkraineUruguayUzbekistanVenezuelaVietnamWest IndiesWestern AfricaWestern AsiaWestern EuropeYemenZaireZimbabweAzores
4 or more Vehicles in Household
Income
Poverty
Unemployment
Labor Participation
Family Structure
Vehicle Availability
Education Level
Disability

4 or more Vehicles in Household Comparison

Alsatians

Immigrants from Israel

Tragic
Tragic
5.4%
4 OR MORE VEHICLES IN HOUSEHOLD
0.3/ 100
METRIC RATING
280th/ 347
METRIC RANK
4.8%
4 OR MORE VEHICLES IN HOUSEHOLD
0.0/ 100
METRIC RATING
313th/ 347
METRIC RANK

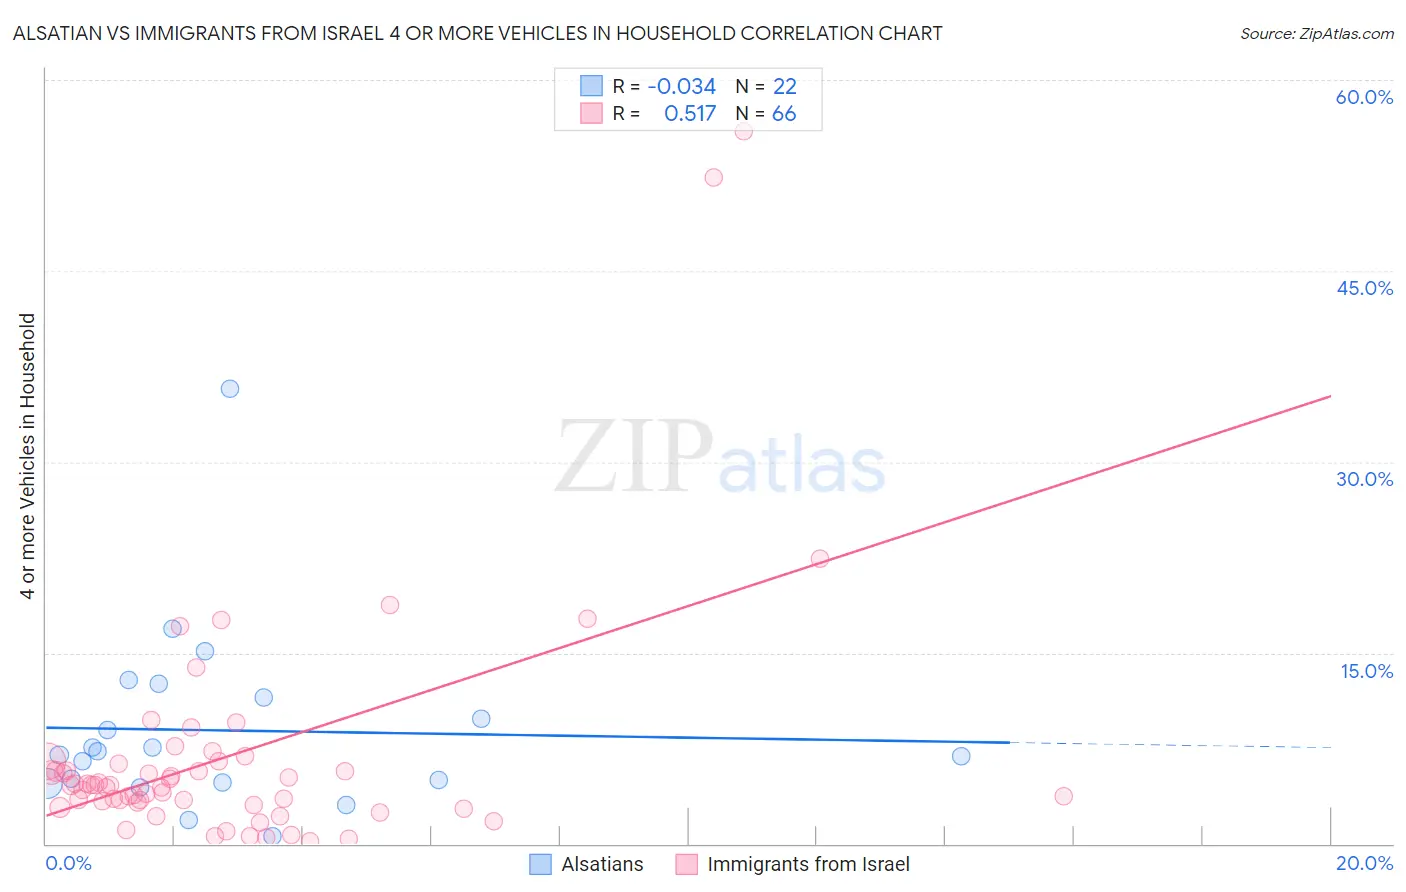
Alsatian vs Immigrants from Israel 4 or more Vehicles in Household Correlation Chart

The statistical analysis conducted on geographies consisting of 82,502,049 people shows no correlation between the proportion of Alsatians and percentage of households with 4 or more vehicles available in the United States with a correlation coefficient (R) of -0.034 and weighted average of 5.4%. Similarly, the statistical analysis conducted on geographies consisting of 208,870,296 people shows a substantial positive correlation between the proportion of Immigrants from Israel and percentage of households with 4 or more vehicles available in the United States with a correlation coefficient (R) of 0.517 and weighted average of 4.8%, a difference of 13.1%.
Alsatian vs Immigrants from Israel 4 or more Vehicles in Household

4 or more Vehicles in Household Correlation Summary

MeasurementAlsatianImmigrants from Israel
Minimum0.60%0.22%
Maximum35.7%55.9%
Range35.1%55.7%
Mean8.9%6.9%
Median7.1%4.6%
Interquartile 25% (IQ1)4.8%3.3%
Interquartile 75% (IQ3)11.5%6.3%
Interquartile Range (IQR)6.7%3.0%
Standard Deviation (Sample)7.3%9.6%
Standard Deviation (Population)7.1%9.5%

Similar Demographics by 4 or more Vehicles in Household

Demographics Similar to Alsatians by 4 or more Vehicles in Household

In terms of 4 or more vehicles in household, the demographic groups most similar to Alsatians are Immigrants from Uruguay (5.4%, a difference of 0.010%), Immigrants from Western Africa (5.4%, a difference of 0.070%), Immigrants from Spain (5.4%, a difference of 0.24%), Immigrants from Ireland (5.4%, a difference of 0.32%), and Immigrants from Eastern Europe (5.4%, a difference of 0.47%).
DemographicsRating | Rank4 or more Vehicles in Household
Macedonians
0.6
/100
|
#273
Tragic
5.5%
Blacks/African Americans
0.6
/100
|
#274
Tragic
5.5%
Cambodians
0.5
/100
|
#275
Tragic
5.5%
Immigrants | Latvia
0.5
/100
|
#276
Tragic
5.5%
Immigrants | Bulgaria
0.5
/100
|
#277
Tragic
5.5%
Immigrants | Eastern Europe
0.4
/100
|
#278
Tragic
5.4%
Immigrants | Uruguay
0.3
/100
|
#279
Tragic
5.4%
Alsatians
0.3
/100
|
#280
Tragic
5.4%
Immigrants | Western Africa
0.3
/100
|
#281
Tragic
5.4%
Immigrants | Spain
0.3
/100
|
#282
Tragic
5.4%
Immigrants | Ireland
0.3
/100
|
#283
Tragic
5.4%
Brazilians
0.3
/100
|
#284
Tragic
5.4%
Immigrants | Liberia
0.2
/100
|
#285
Tragic
5.4%
Immigrants | Colombia
0.2
/100
|
#286
Tragic
5.4%
Immigrants | Croatia
0.2
/100
|
#287
Tragic
5.4%

Demographics Similar to Immigrants from Israel by 4 or more Vehicles in Household

In terms of 4 or more vehicles in household, the demographic groups most similar to Immigrants from Israel are Albanian (4.8%, a difference of 0.010%), Immigrants from West Indies (4.7%, a difference of 0.79%), Immigrants from Belarus (4.7%, a difference of 0.88%), Puerto Rican (4.7%, a difference of 1.3%), and Houma (4.9%, a difference of 2.7%).
DemographicsRating | Rank4 or more Vehicles in Household
Immigrants | Serbia
0.0
/100
|
#306
Tragic
5.0%
Menominee
0.0
/100
|
#307
Tragic
5.0%
Paraguayans
0.0
/100
|
#308
Tragic
4.9%
Immigrants | Somalia
0.0
/100
|
#309
Tragic
4.9%
Moroccans
0.0
/100
|
#310
Tragic
4.9%
Houma
0.0
/100
|
#311
Tragic
4.9%
Albanians
0.0
/100
|
#312
Tragic
4.8%
Immigrants | Israel
0.0
/100
|
#313
Tragic
4.8%
Immigrants | West Indies
0.0
/100
|
#314
Tragic
4.7%
Immigrants | Belarus
0.0
/100
|
#315
Tragic
4.7%
Puerto Ricans
0.0
/100
|
#316
Tragic
4.7%
U.S. Virgin Islanders
0.0
/100
|
#317
Tragic
4.6%
Jamaicans
0.0
/100
|
#318
Tragic
4.6%
Haitians
0.0
/100
|
#319
Tragic
4.6%
Immigrants | Haiti
0.0
/100
|
#320
Tragic
4.5%