Immigrants from Guatemala vs Immigrants from Zaire Unemployment Among Women with Children Ages 6 to 17 years
COMPARE
Immigrants from Guatemala
Immigrants from Zaire
Unemployment Among Women with Children Ages 6 to 17 years
Unemployment Among Women with Children Ages 6 to 17 years Comparison
Immigrants from Guatemala
Immigrants from Zaire
9.4%
UNEMPLOYMENT AMONG WOMEN WITH CHILDREN AGES 6 TO 17 YEARS
1.3/ 100
METRIC RATING
250th/ 347
METRIC RANK
9.0%
UNEMPLOYMENT AMONG WOMEN WITH CHILDREN AGES 6 TO 17 YEARS
38.3/ 100
METRIC RATING
179th/ 347
METRIC RANK
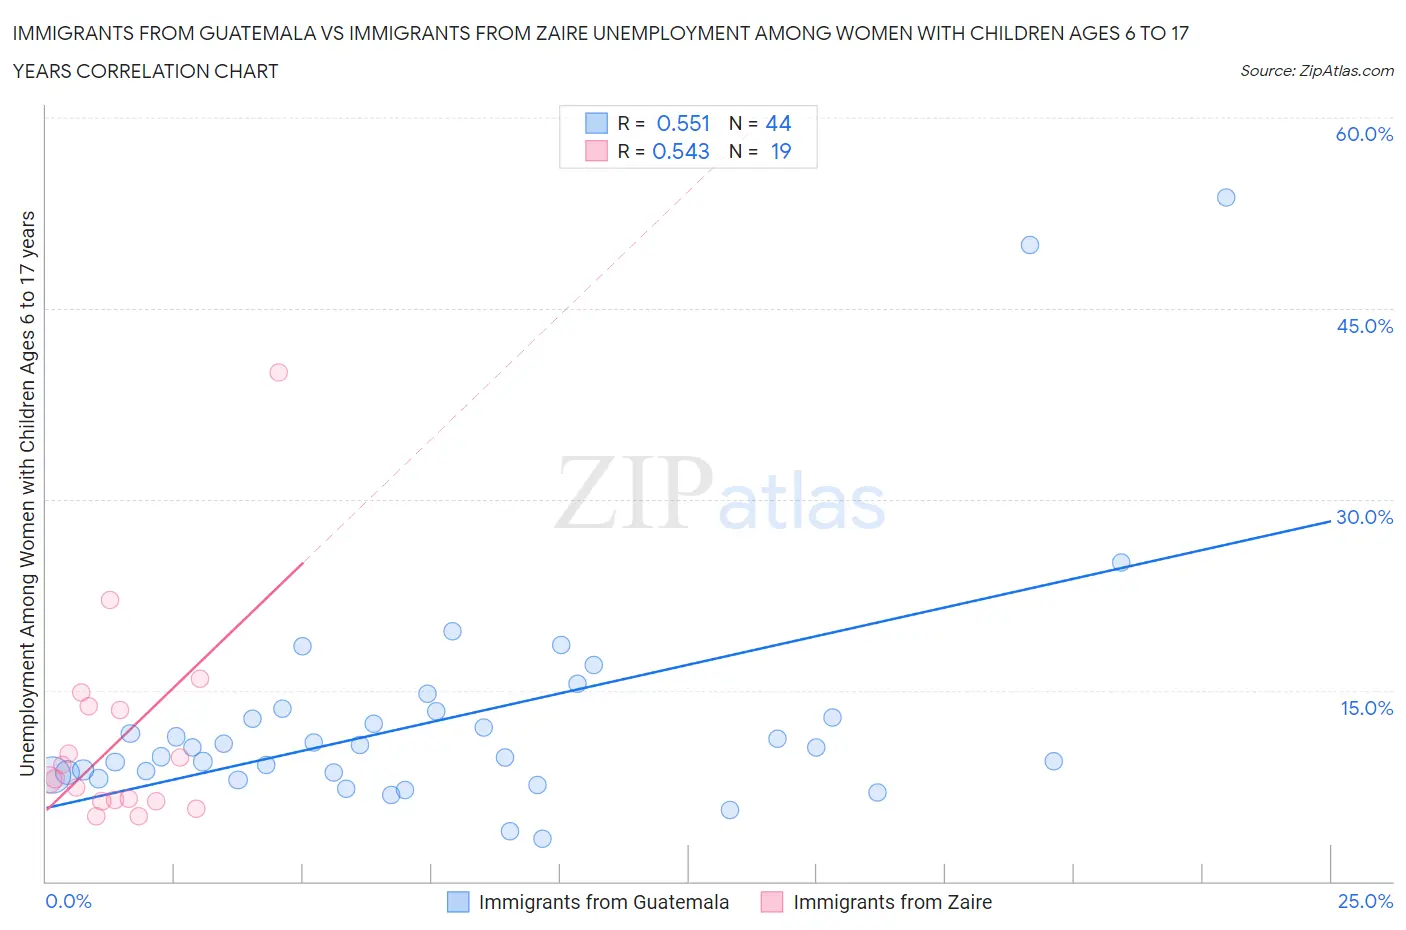
Immigrants from Guatemala vs Immigrants from Zaire Unemployment Among Women with Children Ages 6 to 17 years Correlation Chart
The statistical analysis conducted on geographies consisting of 280,581,568 people shows a substantial positive correlation between the proportion of Immigrants from Guatemala and unemployment rate among women with children between the ages 6 and 17 in the United States with a correlation coefficient (R) of 0.551 and weighted average of 9.4%. Similarly, the statistical analysis conducted on geographies consisting of 94,396,135 people shows a substantial positive correlation between the proportion of Immigrants from Zaire and unemployment rate among women with children between the ages 6 and 17 in the United States with a correlation coefficient (R) of 0.543 and weighted average of 9.0%, a difference of 4.2%.
Unemployment Among Women with Children Ages 6 to 17 years Correlation Summary
| Measurement | Immigrants from Guatemala | Immigrants from Zaire |
| Minimum | 3.3% | 5.1% |
| Maximum | 53.7% | 40.0% |
| Range | 50.4% | 34.9% |
| Mean | 12.8% | 11.2% |
| Median | 10.5% | 8.0% |
| Interquartile 25% (IQ1) | 8.4% | 6.3% |
| Interquartile 75% (IQ3) | 13.1% | 13.7% |
| Interquartile Range (IQR) | 4.7% | 7.4% |
| Standard Deviation (Sample) | 9.6% | 8.3% |
| Standard Deviation (Population) | 9.5% | 8.1% |
Similar Demographics by Unemployment Among Women with Children Ages 6 to 17 years
Demographics Similar to Immigrants from Guatemala by Unemployment Among Women with Children Ages 6 to 17 years
In terms of unemployment among women with children ages 6 to 17 years, the demographic groups most similar to Immigrants from Guatemala are Central American (9.4%, a difference of 0.020%), Immigrants from South America (9.4%, a difference of 0.090%), Dutch (9.4%, a difference of 0.10%), Creek (9.4%, a difference of 0.11%), and Polish (9.4%, a difference of 0.14%).
| Demographics | Rating | Rank | Unemployment Among Women with Children Ages 6 to 17 years |
| Scottish | 2.0 /100 | #243 | Tragic 9.4% |
| English | 1.9 /100 | #244 | Tragic 9.4% |
| Immigrants | Cameroon | 1.8 /100 | #245 | Tragic 9.4% |
| Immigrants | Africa | 1.6 /100 | #246 | Tragic 9.4% |
| Poles | 1.5 /100 | #247 | Tragic 9.4% |
| Dutch | 1.5 /100 | #248 | Tragic 9.4% |
| Immigrants | South America | 1.5 /100 | #249 | Tragic 9.4% |
| Immigrants | Guatemala | 1.3 /100 | #250 | Tragic 9.4% |
| Central Americans | 1.3 /100 | #251 | Tragic 9.4% |
| Creek | 1.2 /100 | #252 | Tragic 9.4% |
| Portuguese | 1.1 /100 | #253 | Tragic 9.4% |
| Nicaraguans | 1.0 /100 | #254 | Tragic 9.4% |
| Lithuanians | 0.9 /100 | #255 | Tragic 9.4% |
| Canadians | 0.8 /100 | #256 | Tragic 9.4% |
| Celtics | 0.7 /100 | #257 | Tragic 9.5% |
Demographics Similar to Immigrants from Zaire by Unemployment Among Women with Children Ages 6 to 17 years
In terms of unemployment among women with children ages 6 to 17 years, the demographic groups most similar to Immigrants from Zaire are Ethiopian (9.0%, a difference of 0.030%), Menominee (9.0%, a difference of 0.040%), Immigrants from Jordan (9.0%, a difference of 0.15%), Immigrants from Czechoslovakia (9.0%, a difference of 0.18%), and South American Indian (9.0%, a difference of 0.19%).
| Demographics | Rating | Rank | Unemployment Among Women with Children Ages 6 to 17 years |
| Immigrants | West Indies | 52.2 /100 | #172 | Average 9.0% |
| Immigrants | Brazil | 51.0 /100 | #173 | Average 9.0% |
| Immigrants | Costa Rica | 50.0 /100 | #174 | Average 9.0% |
| Immigrants | Sierra Leone | 45.9 /100 | #175 | Average 9.0% |
| Immigrants | Italy | 43.7 /100 | #176 | Average 9.0% |
| Immigrants | Jordan | 41.6 /100 | #177 | Average 9.0% |
| Menominee | 39.3 /100 | #178 | Fair 9.0% |
| Immigrants | Zaire | 38.3 /100 | #179 | Fair 9.0% |
| Ethiopians | 37.6 /100 | #180 | Fair 9.0% |
| Immigrants | Czechoslovakia | 34.5 /100 | #181 | Fair 9.0% |
| South American Indians | 34.4 /100 | #182 | Fair 9.0% |
| Swiss | 33.5 /100 | #183 | Fair 9.0% |
| Palestinians | 33.4 /100 | #184 | Fair 9.0% |
| Immigrants | Congo | 32.5 /100 | #185 | Fair 9.0% |
| Immigrants | Spain | 32.4 /100 | #186 | Fair 9.0% |