Immigrants from England vs Immigrants from Belize Unemployment Among Women with Children Ages 6 to 17 years
COMPARE
Immigrants from England
Immigrants from Belize
Unemployment Among Women with Children Ages 6 to 17 years
Unemployment Among Women with Children Ages 6 to 17 years Comparison
Immigrants from England
Immigrants from Belize
8.9%
UNEMPLOYMENT AMONG WOMEN WITH CHILDREN AGES 6 TO 17 YEARS
57.7/ 100
METRIC RATING
167th/ 347
METRIC RANK
9.3%
UNEMPLOYMENT AMONG WOMEN WITH CHILDREN AGES 6 TO 17 YEARS
2.8/ 100
METRIC RATING
237th/ 347
METRIC RANK
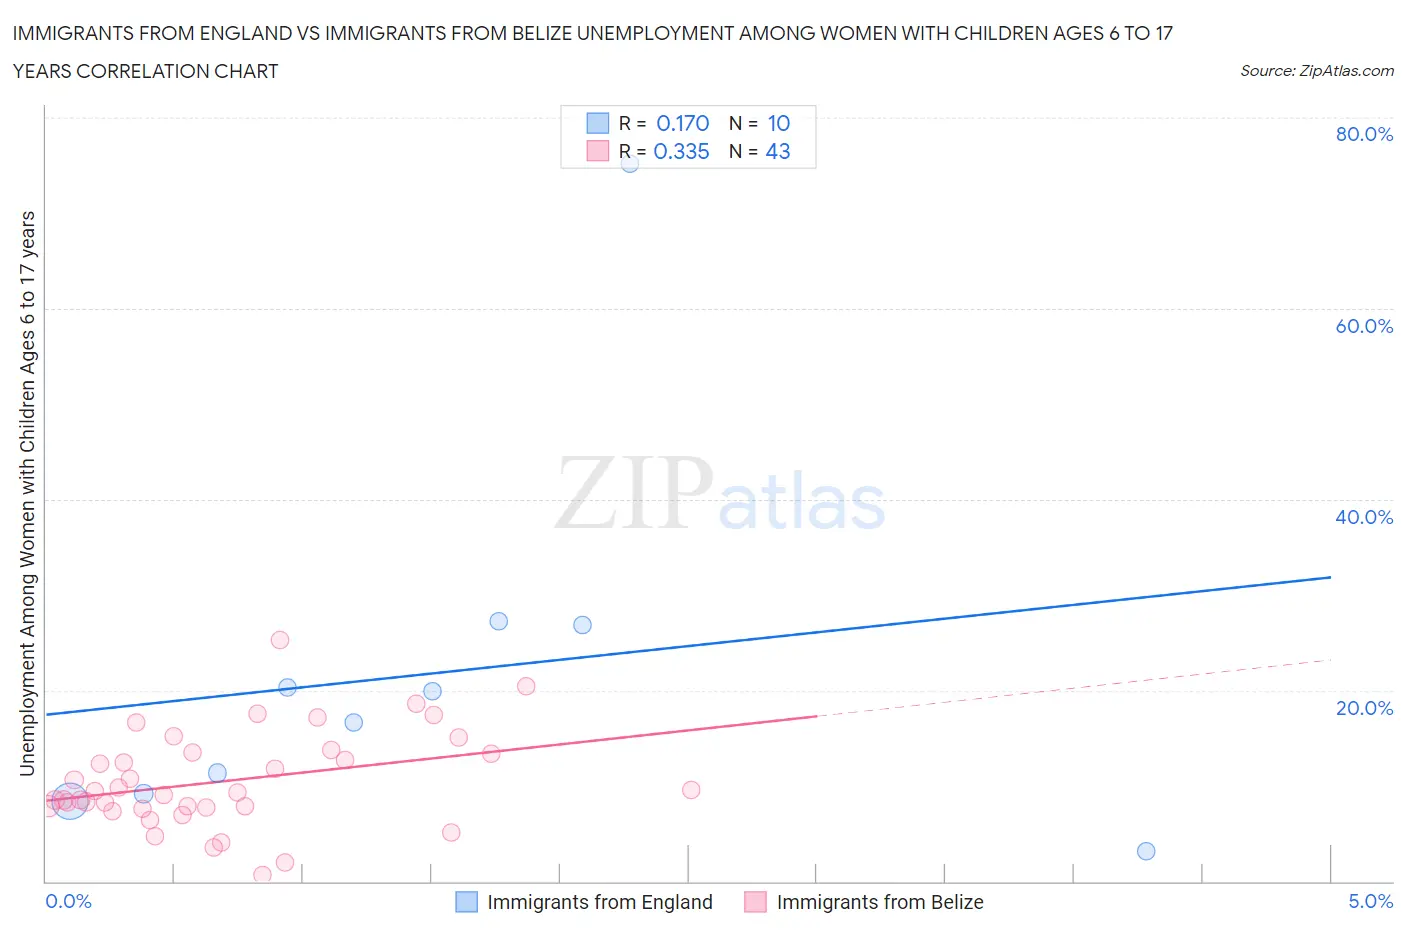
Immigrants from England vs Immigrants from Belize Unemployment Among Women with Children Ages 6 to 17 years Correlation Chart
The statistical analysis conducted on geographies consisting of 278,323,272 people shows a poor positive correlation between the proportion of Immigrants from England and unemployment rate among women with children between the ages 6 and 17 in the United States with a correlation coefficient (R) of 0.170 and weighted average of 8.9%. Similarly, the statistical analysis conducted on geographies consisting of 113,544,654 people shows a mild positive correlation between the proportion of Immigrants from Belize and unemployment rate among women with children between the ages 6 and 17 in the United States with a correlation coefficient (R) of 0.335 and weighted average of 9.3%, a difference of 4.3%.
Unemployment Among Women with Children Ages 6 to 17 years Correlation Summary
| Measurement | Immigrants from England | Immigrants from Belize |
| Minimum | 3.1% | 0.70% |
| Maximum | 75.1% | 25.2% |
| Range | 72.0% | 24.5% |
| Mean | 21.8% | 10.5% |
| Median | 18.3% | 9.3% |
| Interquartile 25% (IQ1) | 9.2% | 7.8% |
| Interquartile 75% (IQ3) | 26.8% | 13.5% |
| Interquartile Range (IQR) | 17.7% | 5.7% |
| Standard Deviation (Sample) | 20.4% | 5.1% |
| Standard Deviation (Population) | 19.3% | 5.0% |
Similar Demographics by Unemployment Among Women with Children Ages 6 to 17 years
Demographics Similar to Immigrants from England by Unemployment Among Women with Children Ages 6 to 17 years
In terms of unemployment among women with children ages 6 to 17 years, the demographic groups most similar to Immigrants from England are Moroccan (8.9%, a difference of 0.030%), Immigrants from Croatia (8.9%, a difference of 0.030%), Immigrants from Micronesia (8.9%, a difference of 0.070%), Ukrainian (8.9%, a difference of 0.090%), and British (8.9%, a difference of 0.11%).
| Demographics | Rating | Rank | Unemployment Among Women with Children Ages 6 to 17 years |
| Immigrants | Hungary | 63.4 /100 | #160 | Good 8.9% |
| Immigrants | Guyana | 63.0 /100 | #161 | Good 8.9% |
| Immigrants | Netherlands | 60.8 /100 | #162 | Good 8.9% |
| Mexican American Indians | 60.6 /100 | #163 | Good 8.9% |
| Ukrainians | 59.7 /100 | #164 | Average 8.9% |
| Immigrants | Micronesia | 59.2 /100 | #165 | Average 8.9% |
| Moroccans | 58.3 /100 | #166 | Average 8.9% |
| Immigrants | England | 57.7 /100 | #167 | Average 8.9% |
| Immigrants | Croatia | 57.1 /100 | #168 | Average 8.9% |
| British | 55.2 /100 | #169 | Average 8.9% |
| Turks | 54.1 /100 | #170 | Average 8.9% |
| Jordanians | 52.2 /100 | #171 | Average 9.0% |
| Immigrants | West Indies | 52.2 /100 | #172 | Average 9.0% |
| Immigrants | Brazil | 51.0 /100 | #173 | Average 9.0% |
| Immigrants | Costa Rica | 50.0 /100 | #174 | Average 9.0% |
Demographics Similar to Immigrants from Belize by Unemployment Among Women with Children Ages 6 to 17 years
In terms of unemployment among women with children ages 6 to 17 years, the demographic groups most similar to Immigrants from Belize are Hungarian (9.3%, a difference of 0.050%), Uruguayan (9.3%, a difference of 0.070%), Arab (9.3%, a difference of 0.080%), Immigrants from Saudi Arabia (9.3%, a difference of 0.080%), and Mexican (9.3%, a difference of 0.14%).
| Demographics | Rating | Rank | Unemployment Among Women with Children Ages 6 to 17 years |
| Welsh | 4.0 /100 | #230 | Tragic 9.3% |
| Macedonians | 3.9 /100 | #231 | Tragic 9.3% |
| French American Indians | 3.7 /100 | #232 | Tragic 9.3% |
| Immigrants | St. Vincent and the Grenadines | 3.3 /100 | #233 | Tragic 9.3% |
| Mexicans | 3.2 /100 | #234 | Tragic 9.3% |
| Uruguayans | 3.0 /100 | #235 | Tragic 9.3% |
| Hungarians | 3.0 /100 | #236 | Tragic 9.3% |
| Immigrants | Belize | 2.8 /100 | #237 | Tragic 9.3% |
| Arabs | 2.7 /100 | #238 | Tragic 9.3% |
| Immigrants | Saudi Arabia | 2.7 /100 | #239 | Tragic 9.3% |
| Guatemalans | 2.3 /100 | #240 | Tragic 9.3% |
| Colombians | 2.2 /100 | #241 | Tragic 9.3% |
| Immigrants | Colombia | 2.1 /100 | #242 | Tragic 9.3% |
| Scottish | 2.0 /100 | #243 | Tragic 9.4% |
| English | 1.9 /100 | #244 | Tragic 9.4% |