Icelander vs Immigrants from Moldova Unemployment Among Women with Children Ages 6 to 17 years

COMPARE

Icelander
Race
Ancestry
AfghanAfricanAlaska NativeAlaskan AthabascanAlbanianAleutAlsatianAmericanApacheArabArapahoArgentineanArmenianAssyrian/Chaldean/SyriacAustralianAustrianBahamianBangladeshiBarbadianBasqueBelgianBelizeanBermudanBhutaneseBlackfeetBolivianBrazilianBritishBritish West IndianBulgarianBurmeseCajunCambodianCanadianCape VerdeanCarpatho RusynCelticCentral AmericanCentral American IndianCherokeeCheyenneChickasawChileanChineseChippewaChoctawColombianColvilleComancheCosta RicanCreeCreekCroatianCrowCubanCypriotCzechCzechoslovakianDanishDelawareDominicanDutchDutch West IndianEastern EuropeanEcuadorianEgyptianEnglishEstonianEthiopianEuropeanFijianFilipinoFinnishFrenchFrench American IndianFrench CanadianGermanGerman RussianGhanaianGreekGuamanian/ChamorroGuatemalanGuyaneseHaitianHmongHonduranHopiHoumaHungarianIcelanderIndian (Asian)IndonesianInupiatIranianIraqiIrishIroquoisIsraeliItalianJamaicanJapaneseJordanianKenyanKiowaKoreanLaotianLatvianLebaneseLiberianLithuanianLumbeeLuxembourgerMacedonianMalaysianMalteseMarshalleseMenomineeMexicanMexican American IndianMongolianMoroccanNative HawaiianNavajoNepaleseNew ZealanderNicaraguanNigerianNorthern EuropeanNorwegianOkinawanOsageOttawaPaiutePakistaniPalestinianPanamanianParaguayanPennsylvania GermanPeruvianPimaPolishPortuguesePotawatomiPuebloPuerto RicanPuget Sound SalishRomanianRussianSalvadoranSamoanScandinavianScotch-IrishScottishSeminoleSenegaleseSerbianShoshoneSierra LeoneanSiouxSlavicSlovakSloveneSomaliSouth AfricanSouth AmericanSouth American IndianSoviet UnionSpaniardSpanishSpanish AmericanSpanish American IndianSri LankanSubsaharan AfricanSudaneseSwedishSwissSyrianTaiwaneseThaiTlingit-HaidaTohono O'OdhamTonganTrinidadian and TobagonianTsimshianTurkishU.S. Virgin IslanderUgandanUkrainianUruguayanUteVenezuelanVietnameseWelshWest IndianYakamaYaquiYugoslavianYumanYup'ikZimbabwean
Immigration
NonimmigrantsImmigrantsAfghanistanAfricaAlbaniaArgentinaArmeniaAsiaAustraliaAustriaBahamasBangladeshBarbadosBelarusBelgiumBelizeBoliviaBosnia and HerzegovinaBrazilBulgariaBurma/MyanmarCabo VerdeCambodiaCameroonCanadaCaribbeanCentral AmericaChileChinaColombiaCongoCosta RicaCroatiaCubaCzechoslovakiaDenmarkDominicaDominican RepublicEastern AfricaEastern AsiaEastern EuropeEcuadorEgyptEl SalvadorEnglandEritreaEthiopiaEuropeFijiFranceGermanyGhanaGreeceGrenadaGuatemalaGuyanaHaitiHondurasHong KongHungaryIndiaIndonesiaIranIraqIrelandIsraelItalyJamaicaJapanJordanKazakhstanKenyaKoreaKuwaitLaosLatin AmericaLatviaLebanonLiberiaLithuaniaMalaysiaMexicoMicronesiaMiddle AfricaMoroccoNepalNetherlandsNicaraguaNigeriaNorth AmericaNorth MacedoniaNorthern AfricaNorthern EuropeNorwayOceaniaPakistanPanamaPeruPhilippinesPolandPortugalRomaniaRussiaSaudi ArabiaScotlandSenegalSerbiaSierra LeoneSingaporeSomaliaSouth AfricaSouth AmericaSouth Central AsiaSouth Eastern AsiaSouthern EuropeSpainSri LankaSt. Vincent and the GrenadinesSudanSwedenSwitzerlandSyriaTaiwanThailandTrinidad and TobagoTurkeyUgandaUkraineUruguayUzbekistanVenezuelaVietnamWest IndiesWestern AfricaWestern AsiaWestern EuropeYemenZaireZimbabweAzores
Immigrants from Moldova
Race
Ancestry
AfghanAfricanAlaska NativeAlaskan AthabascanAlbanianAleutAlsatianAmericanApacheArabArapahoArgentineanArmenianAssyrian/Chaldean/SyriacAustralianAustrianBahamianBangladeshiBarbadianBasqueBelgianBelizeanBermudanBhutaneseBlackfeetBolivianBrazilianBritishBritish West IndianBulgarianBurmeseCajunCambodianCanadianCape VerdeanCarpatho RusynCelticCentral AmericanCentral American IndianCherokeeCheyenneChickasawChileanChineseChippewaChoctawColombianColvilleComancheCosta RicanCreeCreekCroatianCrowCubanCypriotCzechCzechoslovakianDanishDelawareDominicanDutchDutch West IndianEastern EuropeanEcuadorianEgyptianEnglishEstonianEthiopianEuropeanFijianFilipinoFinnishFrenchFrench American IndianFrench CanadianGermanGerman RussianGhanaianGreekGuamanian/ChamorroGuatemalanGuyaneseHaitianHmongHonduranHopiHoumaHungarianIndian (Asian)IndonesianInupiatIranianIraqiIrishIroquoisIsraeliItalianJamaicanJapaneseJordanianKenyanKiowaKoreanLaotianLatvianLebaneseLiberianLithuanianLumbeeLuxembourgerMacedonianMalaysianMalteseMarshalleseMenomineeMexicanMexican American IndianMongolianMoroccanNative HawaiianNavajoNepaleseNew ZealanderNicaraguanNigerianNorthern EuropeanNorwegianOkinawanOsageOttawaPaiutePakistaniPalestinianPanamanianParaguayanPennsylvania GermanPeruvianPimaPolishPortuguesePotawatomiPuebloPuerto RicanPuget Sound SalishRomanianRussianSalvadoranSamoanScandinavianScotch-IrishScottishSeminoleSenegaleseSerbianShoshoneSierra LeoneanSiouxSlavicSlovakSloveneSomaliSouth AfricanSouth AmericanSouth American IndianSoviet UnionSpaniardSpanishSpanish AmericanSpanish American IndianSri LankanSubsaharan AfricanSudaneseSwedishSwissSyrianTaiwaneseThaiTlingit-HaidaTohono O'OdhamTonganTrinidadian and TobagonianTsimshianTurkishU.S. Virgin IslanderUgandanUkrainianUruguayanUteVenezuelanVietnameseWelshWest IndianYakamaYaquiYugoslavianYumanYup'ikZimbabwean
Immigration
NonimmigrantsImmigrantsAfghanistanAfricaAlbaniaArgentinaArmeniaAsiaAustraliaAustriaBahamasBangladeshBarbadosBelarusBelgiumBelizeBoliviaBosnia and HerzegovinaBrazilBulgariaBurma/MyanmarCabo VerdeCambodiaCameroonCanadaCaribbeanCentral AmericaChileChinaColombiaCongoCosta RicaCroatiaCubaCzechoslovakiaDenmarkDominicaDominican RepublicEastern AfricaEastern AsiaEastern EuropeEcuadorEgyptEl SalvadorEnglandEritreaEthiopiaEuropeFijiFranceGermanyGhanaGreeceGrenadaGuatemalaGuyanaHaitiHondurasHong KongHungaryIndiaIndonesiaIranIraqIrelandIsraelItalyJamaicaJapanJordanKazakhstanKenyaKoreaKuwaitLaosLatin AmericaLatviaLebanonLiberiaLithuaniaMalaysiaMexicoMicronesiaMiddle AfricaMoldovaMoroccoNepalNetherlandsNicaraguaNigeriaNorth AmericaNorth MacedoniaNorthern AfricaNorthern EuropeNorwayOceaniaPakistanPanamaPeruPhilippinesPolandPortugalRomaniaRussiaSaudi ArabiaScotlandSenegalSerbiaSierra LeoneSingaporeSomaliaSouth AfricaSouth AmericaSouth Central AsiaSouth Eastern AsiaSouthern EuropeSpainSri LankaSt. Vincent and the GrenadinesSudanSwedenSwitzerlandSyriaTaiwanThailandTrinidad and TobagoTurkeyUgandaUkraineUruguayUzbekistanVenezuelaVietnamWest IndiesWestern AfricaWestern AsiaWestern EuropeYemenZaireZimbabweAzores
Unemployment Among Women with Children Ages 6 to 17 years
Income
Poverty
Unemployment
Labor Participation
Family Structure
Vehicle Availability
Education Level
Disability

Unemployment Among Women with Children Ages 6 to 17 years Comparison

Icelanders

Immigrants from Moldova

Exceptional
Exceptional
8.1%
UNEMPLOYMENT AMONG WOMEN WITH CHILDREN AGES 6 TO 17 YEARS
100.0/ 100
METRIC RATING
46th/ 347
METRIC RANK
8.4%
UNEMPLOYMENT AMONG WOMEN WITH CHILDREN AGES 6 TO 17 YEARS
99.7/ 100
METRIC RATING
76th/ 347
METRIC RANK

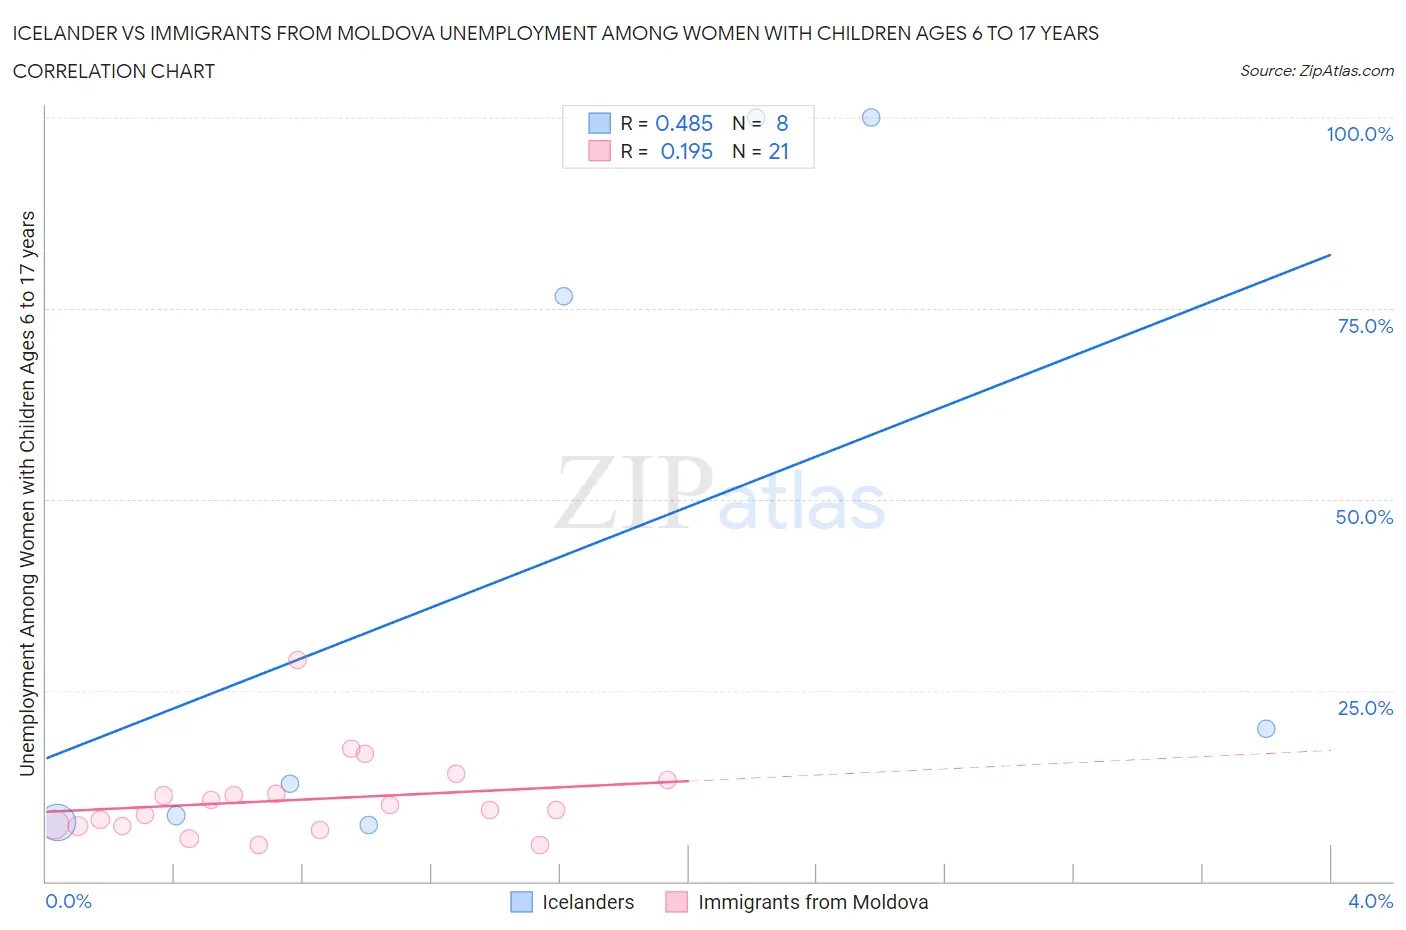
Icelander vs Immigrants from Moldova Unemployment Among Women with Children Ages 6 to 17 years Correlation Chart

The statistical analysis conducted on geographies consisting of 127,654,017 people shows a moderate positive correlation between the proportion of Icelanders and unemployment rate among women with children between the ages 6 and 17 in the United States with a correlation coefficient (R) of 0.485 and weighted average of 8.1%. Similarly, the statistical analysis conducted on geographies consisting of 104,002,938 people shows a poor positive correlation between the proportion of Immigrants from Moldova and unemployment rate among women with children between the ages 6 and 17 in the United States with a correlation coefficient (R) of 0.195 and weighted average of 8.4%, a difference of 4.0%.
Icelander vs Immigrants from Moldova Unemployment Among Women with Children Ages 6 to 17 years

Unemployment Among Women with Children Ages 6 to 17 years Correlation Summary

MeasurementIcelanderImmigrants from Moldova
Minimum7.3%4.7%
Maximum100.0%29.0%
Range92.7%24.3%
Mean41.6%10.7%
Median16.4%9.3%
Interquartile 25% (IQ1)8.1%7.2%
Interquartile 75% (IQ3)88.3%12.4%
Interquartile Range (IQR)80.2%5.1%
Standard Deviation (Sample)42.7%5.5%
Standard Deviation (Population)39.9%5.3%

Similar Demographics by Unemployment Among Women with Children Ages 6 to 17 years

Demographics Similar to Icelanders by Unemployment Among Women with Children Ages 6 to 17 years

In terms of unemployment among women with children ages 6 to 17 years, the demographic groups most similar to Icelanders are Immigrants from Bulgaria (8.1%, a difference of 0.020%), Immigrants from Switzerland (8.1%, a difference of 0.040%), Immigrants from Sweden (8.1%, a difference of 0.060%), Bhutanese (8.1%, a difference of 0.10%), and Immigrants from Asia (8.1%, a difference of 0.17%).
DemographicsRating | RankUnemployment Among Women with Children Ages 6 to 17 years
Somalis
100.0
/100
|
#39
Exceptional
8.0%
Immigrants | Zimbabwe
100.0
/100
|
#40
Exceptional
8.0%
Iranians
100.0
/100
|
#41
Exceptional
8.0%
Immigrants | Somalia
100.0
/100
|
#42
Exceptional
8.0%
Bhutanese
100.0
/100
|
#43
Exceptional
8.1%
Immigrants | Sweden
100.0
/100
|
#44
Exceptional
8.1%
Immigrants | Bulgaria
100.0
/100
|
#45
Exceptional
8.1%
Icelanders
100.0
/100
|
#46
Exceptional
8.1%
Immigrants | Switzerland
100.0
/100
|
#47
Exceptional
8.1%
Immigrants | Asia
100.0
/100
|
#48
Exceptional
8.1%
Immigrants | Oceania
100.0
/100
|
#49
Exceptional
8.1%
Hawaiians
100.0
/100
|
#50
Exceptional
8.1%
Immigrants | Sudan
100.0
/100
|
#51
Exceptional
8.1%
Immigrants | Iraq
100.0
/100
|
#52
Exceptional
8.1%
Danes
100.0
/100
|
#53
Exceptional
8.1%

Demographics Similar to Immigrants from Moldova by Unemployment Among Women with Children Ages 6 to 17 years

In terms of unemployment among women with children ages 6 to 17 years, the demographic groups most similar to Immigrants from Moldova are Immigrants from Sri Lanka (8.4%, a difference of 0.020%), Iraqi (8.4%, a difference of 0.050%), Samoan (8.4%, a difference of 0.11%), Pakistani (8.4%, a difference of 0.19%), and Mongolian (8.4%, a difference of 0.20%).
DemographicsRating | RankUnemployment Among Women with Children Ages 6 to 17 years
Immigrants | Thailand
99.9
/100
|
#69
Exceptional
8.3%
Norwegians
99.9
/100
|
#70
Exceptional
8.3%
Immigrants | Australia
99.8
/100
|
#71
Exceptional
8.3%
Immigrants | Nepal
99.8
/100
|
#72
Exceptional
8.3%
Spanish Americans
99.8
/100
|
#73
Exceptional
8.4%
Samoans
99.7
/100
|
#74
Exceptional
8.4%
Immigrants | Sri Lanka
99.7
/100
|
#75
Exceptional
8.4%
Immigrants | Moldova
99.7
/100
|
#76
Exceptional
8.4%
Iraqis
99.7
/100
|
#77
Exceptional
8.4%
Pakistanis
99.6
/100
|
#78
Exceptional
8.4%
Mongolians
99.6
/100
|
#79
Exceptional
8.4%
Immigrants | Belarus
99.6
/100
|
#80
Exceptional
8.4%
Immigrants | Bolivia
99.6
/100
|
#81
Exceptional
8.4%
Cypriots
99.6
/100
|
#82
Exceptional
8.4%
Bulgarians
99.5
/100
|
#83
Exceptional
8.4%