Zip Codes with the Highest Percentage of Hawaiian / Pacific Population in Mabank, TX
RELATED REPORTS & OPTIONS
Hawaiian / Pacific
Mabank
Compare Zip Codes
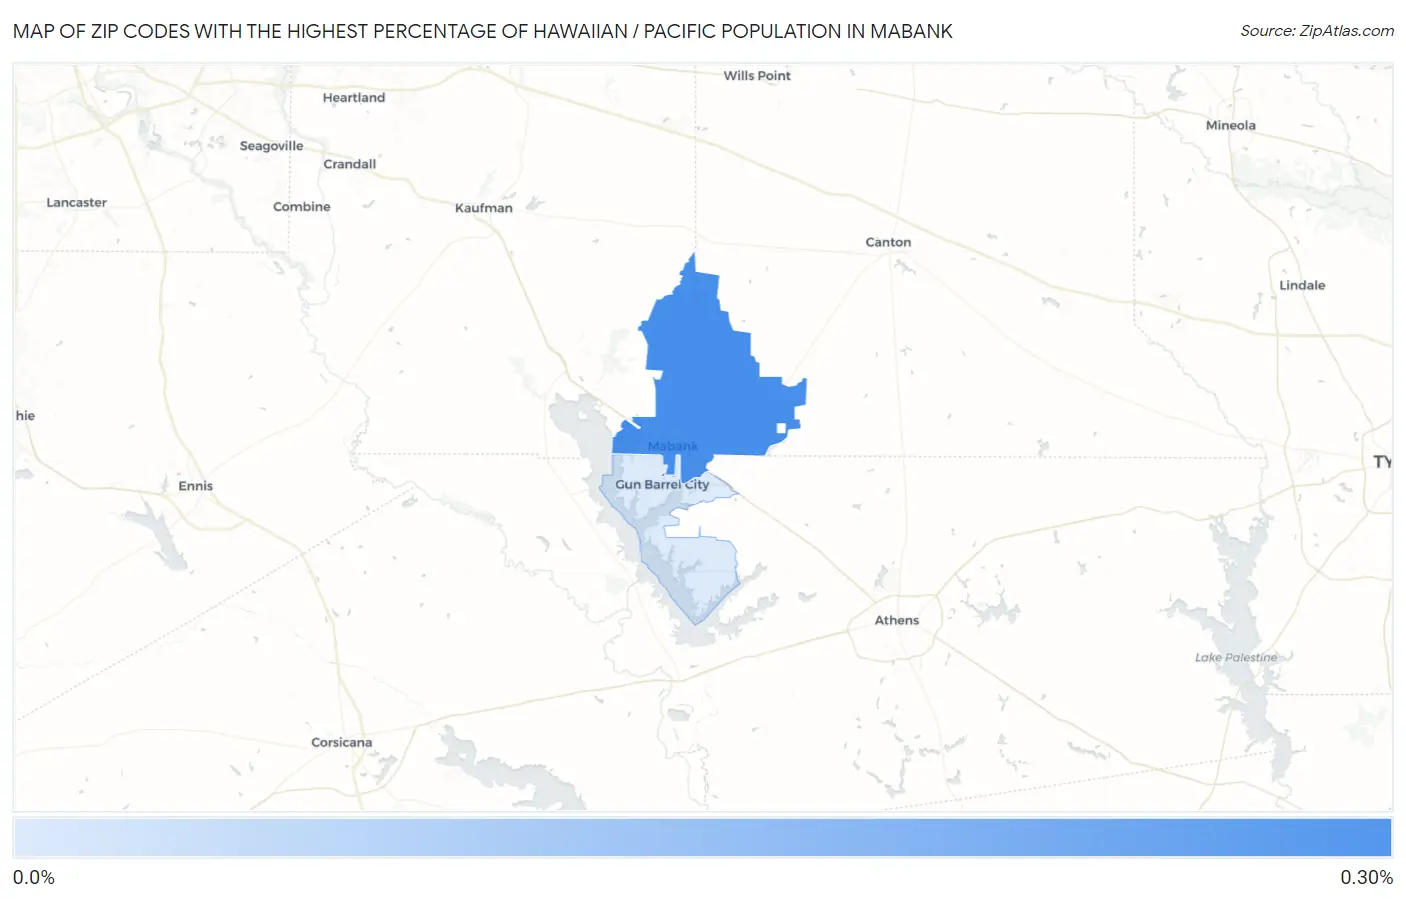
Map of Zip Codes with the Highest Percentage of Hawaiian / Pacific Population in Mabank
0.0%
0.30%
Zip Codes with the Highest Percentage of Hawaiian / Pacific Population in Mabank, TX
| Zip Code | Hawaiian / Pacific | vs State | vs National | |
| 1. | 75147 | 0.28% | 0.094%(+0.186)#128 | 0.19%(+0.090)#2,249 |
| 2. | 75156 | 0.068% | 0.094%(-0.026)#323 | 0.19%(-0.121)#4,691 |
1
Common Questions
What are the Top Zip Codes with the Highest Percentage of Hawaiian / Pacific Population in Mabank, TX?
Top Zip Codes with the Highest Percentage of Hawaiian / Pacific Population in Mabank, TX are:
What zip code has the Highest Percentage of Hawaiian / Pacific Population in Mabank, TX?
75147 has the Highest Percentage of Hawaiian / Pacific Population in Mabank, TX with 0.28%.
What is the Percentage of Hawaiian / Pacific Population in Mabank, TX?
Percentage of Hawaiian / Pacific Population in Mabank is 0.59%.
What is the Percentage of Hawaiian / Pacific Population in Texas?
Percentage of Hawaiian / Pacific Population in Texas is 0.094%.
What is the Percentage of Hawaiian / Pacific Population in the United States?
Percentage of Hawaiian / Pacific Population in the United States is 0.19%.