Zip Codes with the Highest Percentage of Population Employed in Office & Administration in Maryville, TN
RELATED REPORTS & OPTIONS
Office & Administration
Maryville
Compare Zip Codes
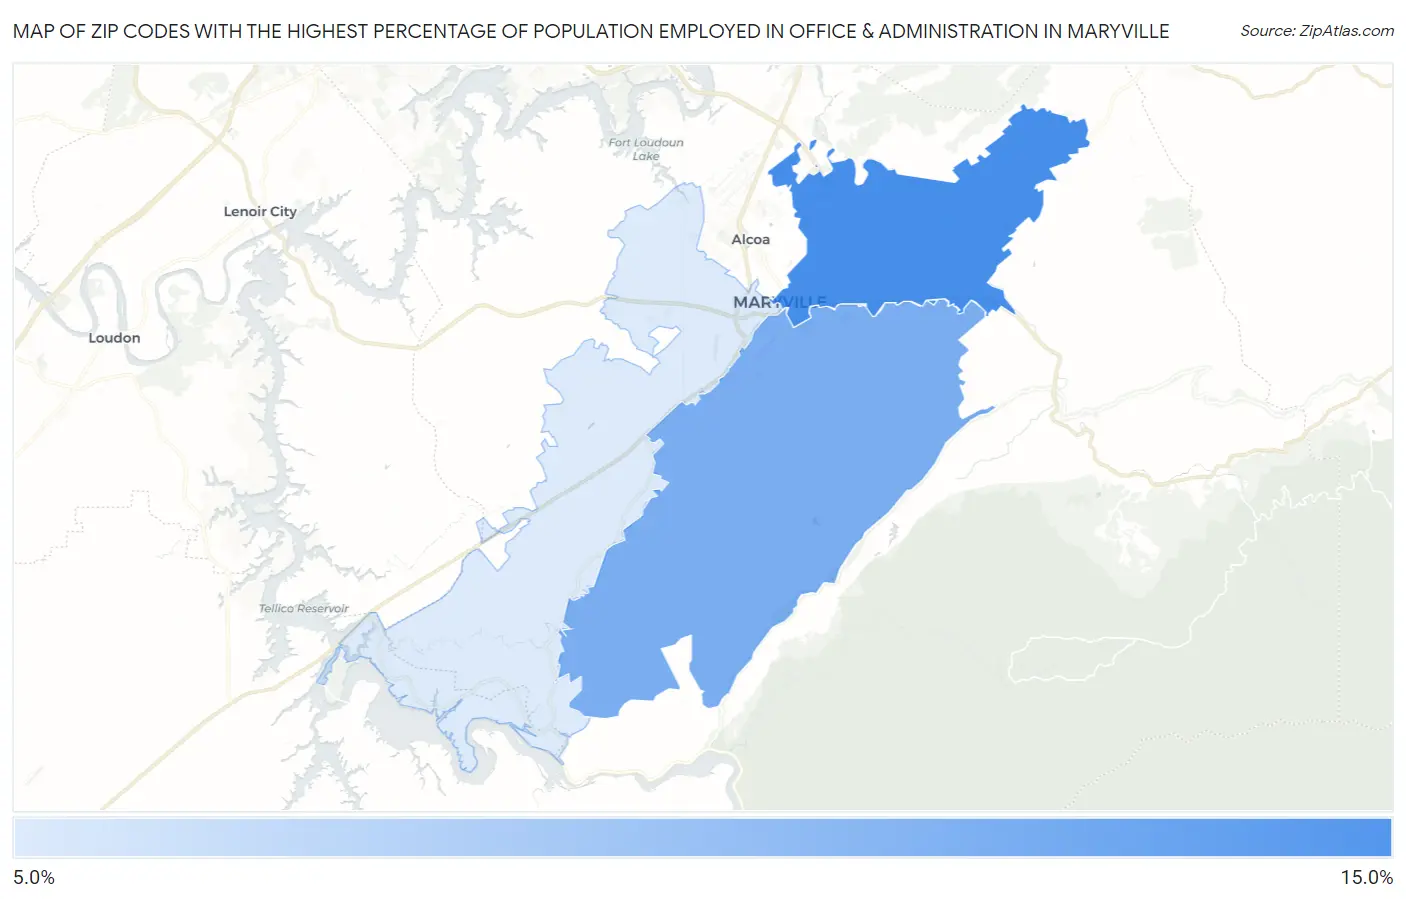
Map of Zip Codes with the Highest Percentage of Population Employed in Office & Administration in Maryville
0.0%
15.0%
Zip Codes with the Highest Percentage of Population Employed in Office & Administration in Maryville, TN
| Zip Code | % Employed | vs State | vs National | |
| 1. | 37804 | 12.1% | 11.3%(+0.768)#199 | 10.9%(+1.23)#10,472 |
| 2. | 37803 | 11.0% | 11.3%(-0.346)#274 | 10.9%(+0.115)#13,919 |
| 3. | 37801 | 8.8% | 11.3%(-2.53)#418 | 10.9%(-2.07)#20,876 |
1
Common Questions
What are the Top Zip Codes with the Highest Percentage of Population Employed in Office & Administration in Maryville, TN?
Top Zip Codes with the Highest Percentage of Population Employed in Office & Administration in Maryville, TN are:
What zip code has the Highest Percentage of Population Employed in Office & Administration in Maryville, TN?
37804 has the Highest Percentage of Population Employed in Office & Administration in Maryville, TN with 12.1%.
What is the Percentage of Population Employed in Office & Administration in Maryville, TN?
Percentage of Population Employed in Office & Administration in Maryville is 10.3%.
What is the Percentage of Population Employed in Office & Administration in Tennessee?
Percentage of Population Employed in Office & Administration in Tennessee is 11.3%.
What is the Percentage of Population Employed in Office & Administration in the United States?
Percentage of Population Employed in Office & Administration in the United States is 10.9%.