Zip Codes with the Highest Percentage of Population Employed in Office & Administration in Clarksville, TN
RELATED REPORTS & OPTIONS
Office & Administration
Clarksville
Compare Zip Codes
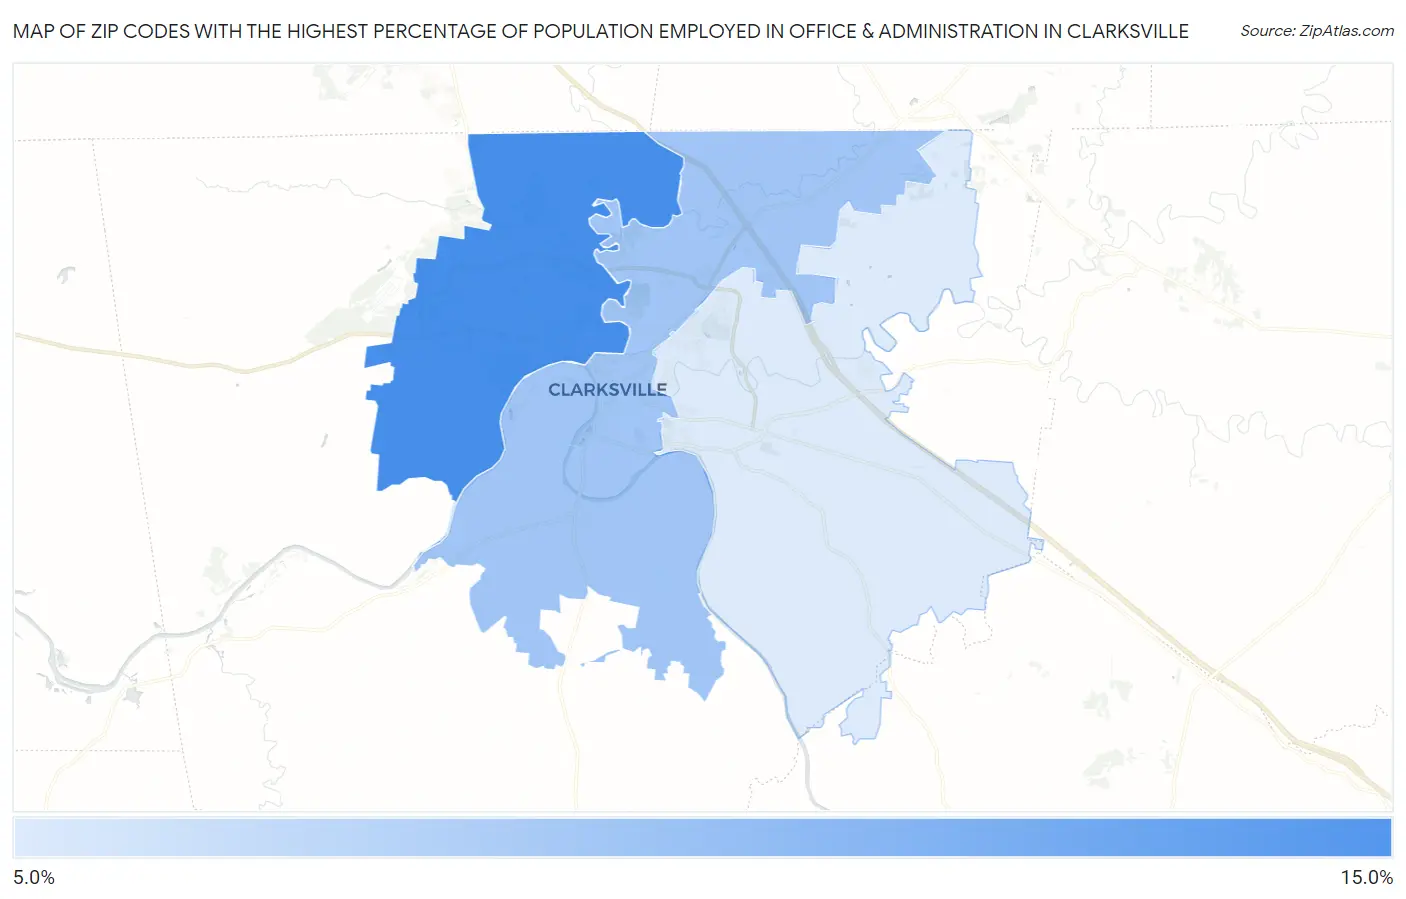
Map of Zip Codes with the Highest Percentage of Population Employed in Office & Administration in Clarksville
0.0%
15.0%
Zip Codes with the Highest Percentage of Population Employed in Office & Administration in Clarksville, TN
| Zip Code | % Employed | vs State | vs National | |
| 1. | 37042 | 13.6% | 11.3%(+2.32)#121 | 10.9%(+2.78)#6,630 |
| 2. | 37040 | 11.4% | 11.3%(+0.059)#245 | 10.9%(+0.520)#12,633 |
| 3. | 37043 | 9.9% | 11.3%(-1.44)#338 | 10.9%(-0.977)#17,524 |
1
Common Questions
What are the Top Zip Codes with the Highest Percentage of Population Employed in Office & Administration in Clarksville, TN?
Top Zip Codes with the Highest Percentage of Population Employed in Office & Administration in Clarksville, TN are:
What zip code has the Highest Percentage of Population Employed in Office & Administration in Clarksville, TN?
37042 has the Highest Percentage of Population Employed in Office & Administration in Clarksville, TN with 13.6%.
What is the Percentage of Population Employed in Office & Administration in Clarksville, TN?
Percentage of Population Employed in Office & Administration in Clarksville is 11.7%.
What is the Percentage of Population Employed in Office & Administration in Tennessee?
Percentage of Population Employed in Office & Administration in Tennessee is 11.3%.
What is the Percentage of Population Employed in Office & Administration in the United States?
Percentage of Population Employed in Office & Administration in the United States is 10.9%.