Zip Codes with the Highest Percentage of Population Employed in Office & Administration in Cordova, TN
RELATED REPORTS & OPTIONS
Office & Administration
Cordova
Compare Zip Codes
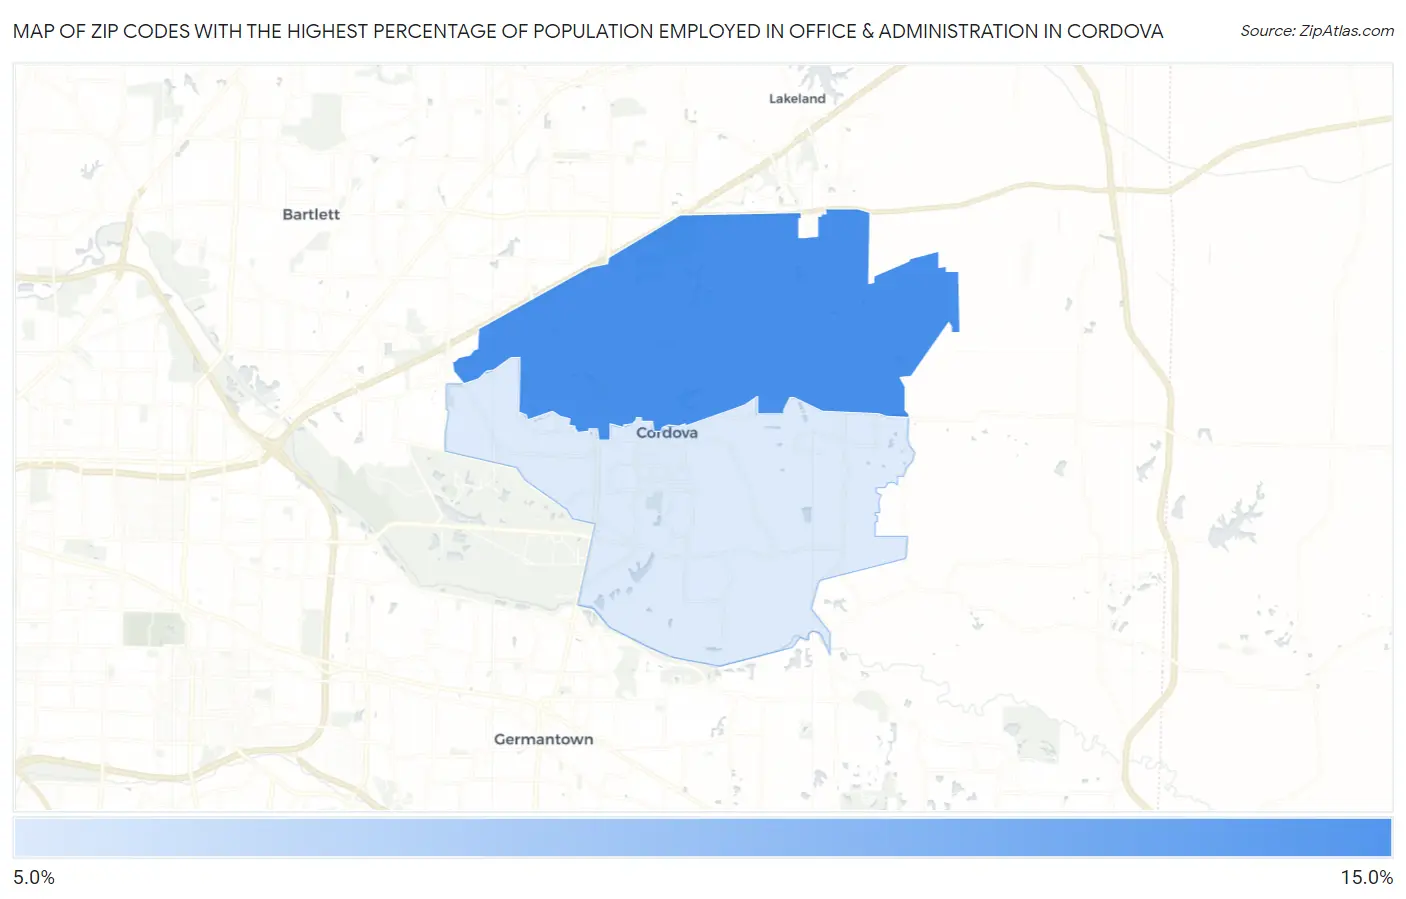
Map of Zip Codes with the Highest Percentage of Population Employed in Office & Administration in Cordova
0.0%
15.0%
Zip Codes with the Highest Percentage of Population Employed in Office & Administration in Cordova, TN
| Zip Code | % Employed | vs State | vs National | |
| 1. | 38016 | 13.7% | 11.3%(+2.41)#115 | 10.9%(+2.87)#6,495 |
| 2. | 38018 | 11.1% | 11.3%(-0.240)#270 | 10.9%(+0.221)#13,605 |
1
Common Questions
What are the Top Zip Codes with the Highest Percentage of Population Employed in Office & Administration in Cordova, TN?
Top Zip Codes with the Highest Percentage of Population Employed in Office & Administration in Cordova, TN are:
What zip code has the Highest Percentage of Population Employed in Office & Administration in Cordova, TN?
38016 has the Highest Percentage of Population Employed in Office & Administration in Cordova, TN with 13.7%.
What is the Percentage of Population Employed in Office & Administration in Tennessee?
Percentage of Population Employed in Office & Administration in Tennessee is 11.3%.
What is the Percentage of Population Employed in Office & Administration in the United States?
Percentage of Population Employed in Office & Administration in the United States is 10.9%.