Zip Codes with the Highest Percentage of Population Employed in Health Diagnosing & Treating in Sevierville, TN
RELATED REPORTS & OPTIONS
Health Diagnosing & Treating
Sevierville
Compare Zip Codes
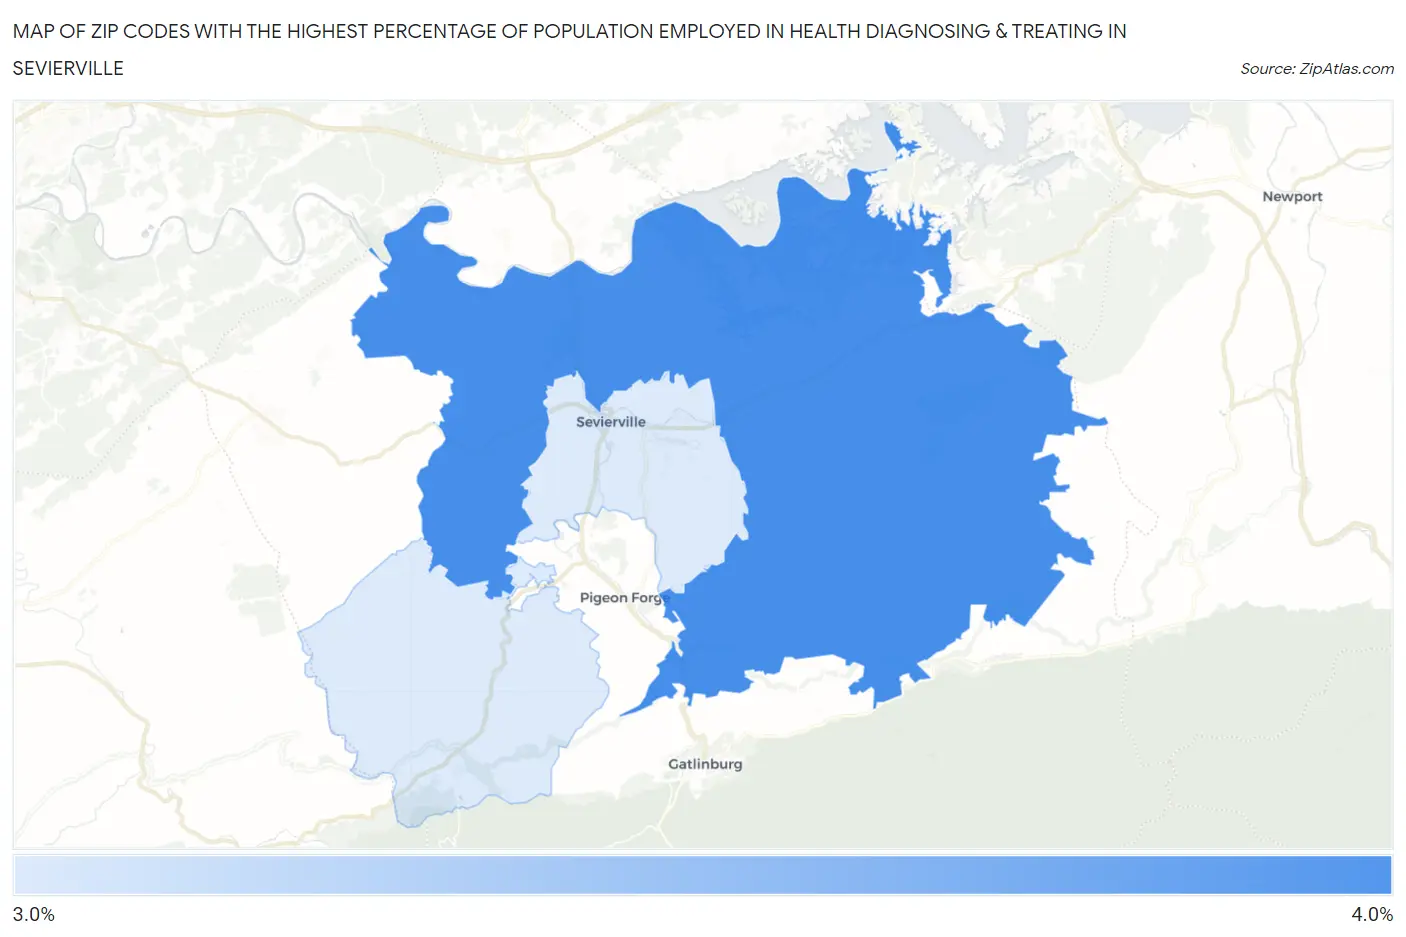
Map of Zip Codes with the Highest Percentage of Population Employed in Health Diagnosing & Treating in Sevierville
0.0%
4.0%
Zip Codes with the Highest Percentage of Population Employed in Health Diagnosing & Treating in Sevierville, TN
| Zip Code | % Employed | vs State | vs National | |
| 1. | 37876 | 3.6% | 6.9%(-3.23)#473 | 6.2%(-2.61)#22,525 |
| 2. | 37862 | 3.5% | 6.9%(-3.32)#478 | 6.2%(-2.71)#22,800 |
1
Common Questions
What are the Top Zip Codes with the Highest Percentage of Population Employed in Health Diagnosing & Treating in Sevierville, TN?
Top Zip Codes with the Highest Percentage of Population Employed in Health Diagnosing & Treating in Sevierville, TN are:
What zip code has the Highest Percentage of Population Employed in Health Diagnosing & Treating in Sevierville, TN?
37876 has the Highest Percentage of Population Employed in Health Diagnosing & Treating in Sevierville, TN with 3.6%.
What is the Percentage of Population Employed in Health Diagnosing & Treating in Sevierville, TN?
Percentage of Population Employed in Health Diagnosing & Treating in Sevierville is 3.7%.
What is the Percentage of Population Employed in Health Diagnosing & Treating in Tennessee?
Percentage of Population Employed in Health Diagnosing & Treating in Tennessee is 6.9%.
What is the Percentage of Population Employed in Health Diagnosing & Treating in the United States?
Percentage of Population Employed in Health Diagnosing & Treating in the United States is 6.2%.