Cree vs Immigrants from Uganda Female Poverty Among 25-34 Year Olds

COMPARE

Cree
Race
Ancestry
AfghanAfricanAlaska NativeAlaskan AthabascanAlbanianAleutAlsatianAmericanApacheArabArapahoArgentineanArmenianAssyrian/Chaldean/SyriacAustralianAustrianBahamianBangladeshiBarbadianBasqueBelgianBelizeanBermudanBhutaneseBlackfeetBolivianBrazilianBritishBritish West IndianBulgarianBurmeseCajunCambodianCanadianCape VerdeanCarpatho RusynCelticCentral AmericanCentral American IndianCherokeeCheyenneChickasawChileanChineseChippewaChoctawColombianColvilleComancheCosta RicanCreeCreekCroatianCrowCubanCypriotCzechCzechoslovakianDanishDelawareDominicanDutchDutch West IndianEastern EuropeanEcuadorianEgyptianEnglishEstonianEthiopianEuropeanFijianFilipinoFinnishFrenchFrench American IndianFrench CanadianGermanGerman RussianGhanaianGreekGuamanian/ChamorroGuatemalanGuyaneseHaitianHmongHonduranHopiHoumaHungarianIcelanderIndian (Asian)IndonesianInupiatIranianIraqiIrishIroquoisIsraeliItalianJamaicanJapaneseJordanianKenyanKiowaKoreanLaotianLatvianLebaneseLiberianLithuanianLumbeeLuxembourgerMacedonianMalaysianMalteseMarshalleseMenomineeMexicanMexican American IndianMongolianMoroccanNative HawaiianNavajoNepaleseNew ZealanderNicaraguanNigerianNorthern EuropeanNorwegianOkinawanOsageOttawaPaiutePakistaniPalestinianPanamanianParaguayanPennsylvania GermanPeruvianPimaPolishPortuguesePotawatomiPuebloPuerto RicanPuget Sound SalishRomanianRussianSalvadoranSamoanScandinavianScotch-IrishScottishSeminoleSenegaleseSerbianShoshoneSierra LeoneanSiouxSlavicSlovakSloveneSomaliSouth AfricanSouth AmericanSouth American IndianSoviet UnionSpaniardSpanishSpanish AmericanSpanish American IndianSri LankanSubsaharan AfricanSudaneseSwedishSwissSyrianTaiwaneseThaiTlingit-HaidaTohono O'OdhamTonganTrinidadian and TobagonianTsimshianTurkishU.S. Virgin IslanderUgandanUkrainianUruguayanUteVenezuelanVietnameseWelshWest IndianYakamaYaquiYugoslavianYumanYup'ikZimbabwean
Immigration
NonimmigrantsImmigrantsAfghanistanAfricaAlbaniaArgentinaArmeniaAsiaAustraliaAustriaBahamasBangladeshBarbadosBelarusBelgiumBelizeBoliviaBosnia and HerzegovinaBrazilBulgariaBurma/MyanmarCabo VerdeCambodiaCameroonCanadaCaribbeanCentral AmericaChileChinaColombiaCongoCosta RicaCroatiaCubaCzechoslovakiaDenmarkDominicaDominican RepublicEastern AfricaEastern AsiaEastern EuropeEcuadorEgyptEl SalvadorEnglandEritreaEthiopiaEuropeFijiFranceGermanyGhanaGreeceGrenadaGuatemalaGuyanaHaitiHondurasHong KongHungaryIndiaIndonesiaIranIraqIrelandIsraelItalyJamaicaJapanJordanKazakhstanKenyaKoreaKuwaitLaosLatin AmericaLatviaLebanonLiberiaLithuaniaMalaysiaMexicoMicronesiaMiddle AfricaMoldovaMoroccoNepalNetherlandsNicaraguaNigeriaNorth AmericaNorth MacedoniaNorthern AfricaNorthern EuropeNorwayOceaniaPakistanPanamaPeruPhilippinesPolandPortugalRomaniaRussiaSaudi ArabiaScotlandSenegalSerbiaSierra LeoneSingaporeSomaliaSouth AfricaSouth AmericaSouth Central AsiaSouth Eastern AsiaSouthern EuropeSpainSri LankaSt. Vincent and the GrenadinesSudanSwedenSwitzerlandSyriaTaiwanThailandTrinidad and TobagoTurkeyUkraineUruguayUzbekistanVenezuelaVietnamWest IndiesWestern AfricaWestern AsiaWestern EuropeYemenZaireZimbabweAzores
Immigrants from Uganda
Race
Ancestry
AfghanAfricanAlaska NativeAlaskan AthabascanAlbanianAleutAlsatianAmericanApacheArabArapahoArgentineanArmenianAssyrian/Chaldean/SyriacAustralianAustrianBahamianBangladeshiBarbadianBasqueBelgianBelizeanBermudanBhutaneseBlackfeetBolivianBrazilianBritishBritish West IndianBulgarianBurmeseCajunCambodianCanadianCape VerdeanCarpatho RusynCelticCentral AmericanCentral American IndianCherokeeCheyenneChickasawChileanChineseChippewaChoctawColombianColvilleComancheCosta RicanCreekCroatianCrowCubanCypriotCzechCzechoslovakianDanishDelawareDominicanDutchDutch West IndianEastern EuropeanEcuadorianEgyptianEnglishEstonianEthiopianEuropeanFijianFilipinoFinnishFrenchFrench American IndianFrench CanadianGermanGerman RussianGhanaianGreekGuamanian/ChamorroGuatemalanGuyaneseHaitianHmongHonduranHopiHoumaHungarianIcelanderIndian (Asian)IndonesianInupiatIranianIraqiIrishIroquoisIsraeliItalianJamaicanJapaneseJordanianKenyanKiowaKoreanLaotianLatvianLebaneseLiberianLithuanianLumbeeLuxembourgerMacedonianMalaysianMalteseMarshalleseMenomineeMexicanMexican American IndianMongolianMoroccanNative HawaiianNavajoNepaleseNew ZealanderNicaraguanNigerianNorthern EuropeanNorwegianOkinawanOsageOttawaPaiutePakistaniPalestinianPanamanianParaguayanPennsylvania GermanPeruvianPimaPolishPortuguesePotawatomiPuebloPuerto RicanPuget Sound SalishRomanianRussianSalvadoranSamoanScandinavianScotch-IrishScottishSeminoleSenegaleseSerbianShoshoneSierra LeoneanSiouxSlavicSlovakSloveneSomaliSouth AfricanSouth AmericanSouth American IndianSoviet UnionSpaniardSpanishSpanish AmericanSpanish American IndianSri LankanSubsaharan AfricanSudaneseSwedishSwissSyrianTaiwaneseThaiTlingit-HaidaTohono O'OdhamTonganTrinidadian and TobagonianTsimshianTurkishU.S. Virgin IslanderUgandanUkrainianUruguayanUteVenezuelanVietnameseWelshWest IndianYakamaYaquiYugoslavianYumanYup'ikZimbabwean
Immigration
NonimmigrantsImmigrantsAfghanistanAfricaAlbaniaArgentinaArmeniaAsiaAustraliaAustriaBahamasBangladeshBarbadosBelarusBelgiumBelizeBoliviaBosnia and HerzegovinaBrazilBulgariaBurma/MyanmarCabo VerdeCambodiaCameroonCanadaCaribbeanCentral AmericaChileChinaColombiaCongoCosta RicaCroatiaCubaCzechoslovakiaDenmarkDominicaDominican RepublicEastern AfricaEastern AsiaEastern EuropeEcuadorEgyptEl SalvadorEnglandEritreaEthiopiaEuropeFijiFranceGermanyGhanaGreeceGrenadaGuatemalaGuyanaHaitiHondurasHong KongHungaryIndiaIndonesiaIranIraqIrelandIsraelItalyJamaicaJapanJordanKazakhstanKenyaKoreaKuwaitLaosLatin AmericaLatviaLebanonLiberiaLithuaniaMalaysiaMexicoMicronesiaMiddle AfricaMoldovaMoroccoNepalNetherlandsNicaraguaNigeriaNorth AmericaNorth MacedoniaNorthern AfricaNorthern EuropeNorwayOceaniaPakistanPanamaPeruPhilippinesPolandPortugalRomaniaRussiaSaudi ArabiaScotlandSenegalSerbiaSierra LeoneSingaporeSomaliaSouth AfricaSouth AmericaSouth Central AsiaSouth Eastern AsiaSouthern EuropeSpainSri LankaSt. Vincent and the GrenadinesSudanSwedenSwitzerlandSyriaTaiwanThailandTrinidad and TobagoTurkeyUgandaUkraineUruguayUzbekistanVenezuelaVietnamWest IndiesWestern AfricaWestern AsiaWestern EuropeYemenZaireZimbabweAzores
Female Poverty Among 25-34 Year Olds
Income
Poverty
Unemployment
Labor Participation
Family Structure
Vehicle Availability
Education Level
Disability

Female Poverty Among 25-34 Year Olds Comparison

Cree

Immigrants from Uganda

Tragic
Average
15.6%
FEMALE POVERTY AMONG 25-34 YEAR OLDS
0.1/ 100
METRIC RATING
271st/ 347
METRIC RANK
13.5%
FEMALE POVERTY AMONG 25-34 YEAR OLDS
53.0/ 100
METRIC RATING
170th/ 347
METRIC RANK

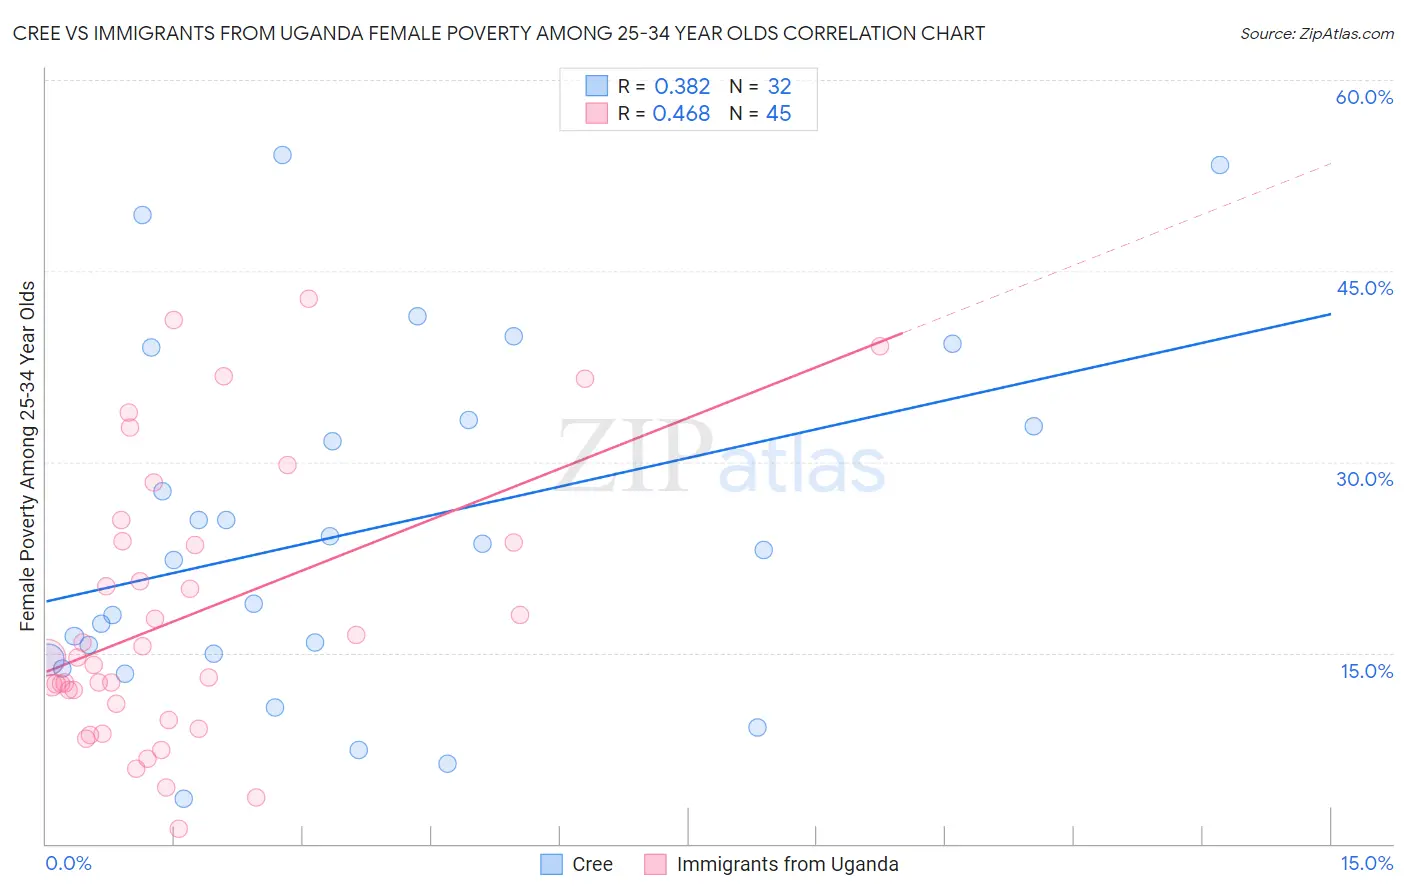
Cree vs Immigrants from Uganda Female Poverty Among 25-34 Year Olds Correlation Chart

The statistical analysis conducted on geographies consisting of 75,962,036 people shows a mild positive correlation between the proportion of Cree and poverty level among females between the ages 25 and 34 in the United States with a correlation coefficient (R) of 0.382 and weighted average of 15.6%. Similarly, the statistical analysis conducted on geographies consisting of 125,339,935 people shows a moderate positive correlation between the proportion of Immigrants from Uganda and poverty level among females between the ages 25 and 34 in the United States with a correlation coefficient (R) of 0.468 and weighted average of 13.5%, a difference of 15.7%.
Cree vs Immigrants from Uganda Female Poverty Among 25-34 Year Olds

Female Poverty Among 25-34 Year Olds Correlation Summary

MeasurementCreeImmigrants from Uganda
Minimum3.5%1.2%
Maximum54.1%42.9%
Range50.6%41.7%
Mean24.4%17.8%
Median22.7%14.6%
Interquartile 25% (IQ1)14.7%10.4%
Interquartile 75% (IQ3)33.1%23.8%
Interquartile Range (IQR)18.4%13.4%
Standard Deviation (Sample)13.7%10.7%
Standard Deviation (Population)13.4%10.6%

Similar Demographics by Female Poverty Among 25-34 Year Olds

Demographics Similar to Cree by Female Poverty Among 25-34 Year Olds

In terms of female poverty among 25-34 year olds, the demographic groups most similar to Cree are British West Indian (15.6%, a difference of 0.010%), Senegalese (15.6%, a difference of 0.060%), Subsaharan African (15.6%, a difference of 0.16%), Nonimmigrants (15.6%, a difference of 0.17%), and Immigrants from Senegal (15.6%, a difference of 0.37%).
DemographicsRating | RankFemale Poverty Among 25-34 Year Olds
Pennsylvania Germans
0.1
/100
|
#264
Tragic
15.4%
Immigrants | Liberia
0.1
/100
|
#265
Tragic
15.4%
Immigrants | Somalia
0.1
/100
|
#266
Tragic
15.4%
Central Americans
0.1
/100
|
#267
Tragic
15.5%
Immigrants | Senegal
0.1
/100
|
#268
Tragic
15.6%
Sub-Saharan Africans
0.1
/100
|
#269
Tragic
15.6%
British West Indians
0.1
/100
|
#270
Tragic
15.6%
Cree
0.1
/100
|
#271
Tragic
15.6%
Senegalese
0.1
/100
|
#272
Tragic
15.6%
Immigrants | Nonimmigrants
0.1
/100
|
#273
Tragic
15.6%
Immigrants | Caribbean
0.0
/100
|
#274
Tragic
15.7%
Immigrants | Azores
0.0
/100
|
#275
Tragic
15.8%
Immigrants | Zaire
0.0
/100
|
#276
Tragic
15.8%
Immigrants | Micronesia
0.0
/100
|
#277
Tragic
15.8%
French American Indians
0.0
/100
|
#278
Tragic
15.9%

Demographics Similar to Immigrants from Uganda by Female Poverty Among 25-34 Year Olds

In terms of female poverty among 25-34 year olds, the demographic groups most similar to Immigrants from Uganda are South American Indian (13.5%, a difference of 0.090%), Immigrants from Costa Rica (13.5%, a difference of 0.090%), Kenyan (13.5%, a difference of 0.10%), Immigrants from Oceania (13.5%, a difference of 0.25%), and Samoan (13.5%, a difference of 0.32%).
DemographicsRating | RankFemale Poverty Among 25-34 Year Olds
British
63.5
/100
|
#163
Good
13.4%
Swiss
61.7
/100
|
#164
Good
13.4%
Basques
59.3
/100
|
#165
Average
13.4%
Belgians
58.9
/100
|
#166
Average
13.4%
Immigrants | Bosnia and Herzegovina
58.6
/100
|
#167
Average
13.4%
Immigrants | Afghanistan
57.7
/100
|
#168
Average
13.4%
Samoans
56.8
/100
|
#169
Average
13.5%
Immigrants | Uganda
53.0
/100
|
#170
Average
13.5%
South American Indians
51.9
/100
|
#171
Average
13.5%
Immigrants | Costa Rica
51.9
/100
|
#172
Average
13.5%
Kenyans
51.8
/100
|
#173
Average
13.5%
Immigrants | Oceania
50.0
/100
|
#174
Average
13.5%
Bermudans
46.8
/100
|
#175
Average
13.6%
Yugoslavians
45.0
/100
|
#176
Average
13.6%
Venezuelans
44.6
/100
|
#177
Average
13.6%