Immigrants from Oceania vs Immigrants from Mexico Married-Couple Family Poverty
COMPARE
Immigrants from Oceania
Immigrants from Mexico
Married-Couple Family Poverty
Married-Couple Family Poverty Comparison
Immigrants from Oceania
Immigrants from Mexico
5.0%
MARRIED-COUPLE FAMILY POVERTY
78.6/ 100
METRIC RATING
149th/ 347
METRIC RANK
7.6%
MARRIED-COUPLE FAMILY POVERTY
0.0/ 100
METRIC RATING
328th/ 347
METRIC RANK
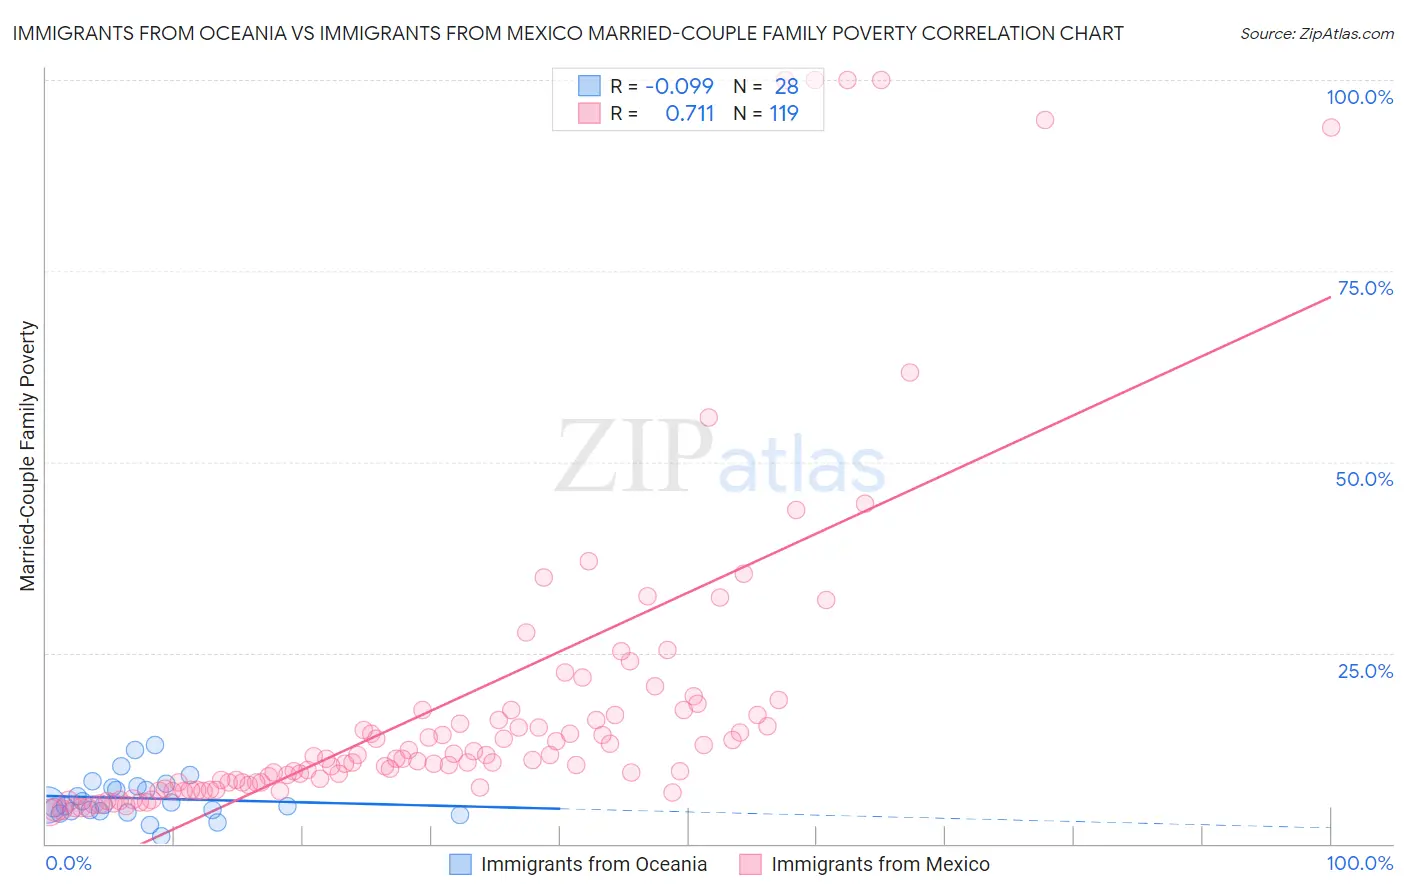
Immigrants from Oceania vs Immigrants from Mexico Married-Couple Family Poverty Correlation Chart
The statistical analysis conducted on geographies consisting of 303,370,151 people shows a slight negative correlation between the proportion of Immigrants from Oceania and poverty level among married-couple families in the United States with a correlation coefficient (R) of -0.099 and weighted average of 5.0%. Similarly, the statistical analysis conducted on geographies consisting of 506,470,232 people shows a strong positive correlation between the proportion of Immigrants from Mexico and poverty level among married-couple families in the United States with a correlation coefficient (R) of 0.711 and weighted average of 7.6%, a difference of 50.9%.
Married-Couple Family Poverty Correlation Summary
| Measurement | Immigrants from Oceania | Immigrants from Mexico |
| Minimum | 1.0% | 4.1% |
| Maximum | 12.9% | 100.0% |
| Range | 11.9% | 95.9% |
| Mean | 6.0% | 18.1% |
| Median | 5.1% | 11.1% |
| Interquartile 25% (IQ1) | 4.2% | 7.8% |
| Interquartile 75% (IQ3) | 7.4% | 16.8% |
| Interquartile Range (IQR) | 3.2% | 9.1% |
| Standard Deviation (Sample) | 2.8% | 21.0% |
| Standard Deviation (Population) | 2.7% | 21.0% |
Similar Demographics by Married-Couple Family Poverty
Demographics Similar to Immigrants from Oceania by Married-Couple Family Poverty
In terms of married-couple family poverty, the demographic groups most similar to Immigrants from Oceania are Syrian (5.0%, a difference of 0.030%), Immigrants from Russia (5.0%, a difference of 0.030%), Brazilian (5.0%, a difference of 0.050%), Mongolian (5.0%, a difference of 0.22%), and Immigrants from Cameroon (5.0%, a difference of 0.23%).
| Demographics | Rating | Rank | Married-Couple Family Poverty |
| Immigrants | China | 84.6 /100 | #142 | Excellent 5.0% |
| Immigrants | Egypt | 83.4 /100 | #143 | Excellent 5.0% |
| Hmong | 83.2 /100 | #144 | Excellent 5.0% |
| Immigrants | Spain | 79.9 /100 | #145 | Good 5.0% |
| Mongolians | 79.8 /100 | #146 | Good 5.0% |
| Syrians | 78.7 /100 | #147 | Good 5.0% |
| Immigrants | Russia | 78.7 /100 | #148 | Good 5.0% |
| Immigrants | Oceania | 78.6 /100 | #149 | Good 5.0% |
| Brazilians | 78.3 /100 | #150 | Good 5.0% |
| Immigrants | Cameroon | 77.3 /100 | #151 | Good 5.0% |
| Albanians | 77.2 /100 | #152 | Good 5.0% |
| Immigrants | Kuwait | 76.3 /100 | #153 | Good 5.0% |
| Delaware | 73.7 /100 | #154 | Good 5.1% |
| Immigrants | Ethiopia | 72.4 /100 | #155 | Good 5.1% |
| Sri Lankans | 72.2 /100 | #156 | Good 5.1% |
Demographics Similar to Immigrants from Mexico by Married-Couple Family Poverty
In terms of married-couple family poverty, the demographic groups most similar to Immigrants from Mexico are Immigrants from Bangladesh (7.5%, a difference of 1.2%), Hispanic or Latino (7.5%, a difference of 1.2%), Immigrants from Cuba (7.5%, a difference of 1.4%), Immigrants from Central America (7.4%, a difference of 2.0%), and Vietnamese (7.4%, a difference of 2.1%).
| Demographics | Rating | Rank | Married-Couple Family Poverty |
| Immigrants | Caribbean | 0.0 /100 | #321 | Tragic 7.3% |
| Immigrants | Honduras | 0.0 /100 | #322 | Tragic 7.3% |
| Vietnamese | 0.0 /100 | #323 | Tragic 7.4% |
| Immigrants | Central America | 0.0 /100 | #324 | Tragic 7.4% |
| Immigrants | Cuba | 0.0 /100 | #325 | Tragic 7.5% |
| Immigrants | Bangladesh | 0.0 /100 | #326 | Tragic 7.5% |
| Hispanics or Latinos | 0.0 /100 | #327 | Tragic 7.5% |
| Immigrants | Mexico | 0.0 /100 | #328 | Tragic 7.6% |
| Natives/Alaskans | 0.0 /100 | #329 | Tragic 8.2% |
| Paiute | 0.0 /100 | #330 | Tragic 8.3% |
| Central American Indians | 0.0 /100 | #331 | Tragic 8.3% |
| Dominicans | 0.0 /100 | #332 | Tragic 8.3% |
| Lumbee | 0.0 /100 | #333 | Tragic 8.3% |
| Immigrants | Dominican Republic | 0.0 /100 | #334 | Tragic 8.4% |
| Sioux | 0.0 /100 | #335 | Tragic 8.7% |