Zip Codes with the Highest Percentage of Population with a Degree in Liberal Arts and History in Butler, PA
RELATED REPORTS & OPTIONS
Liberal Arts and History
Butler
Compare Zip Codes
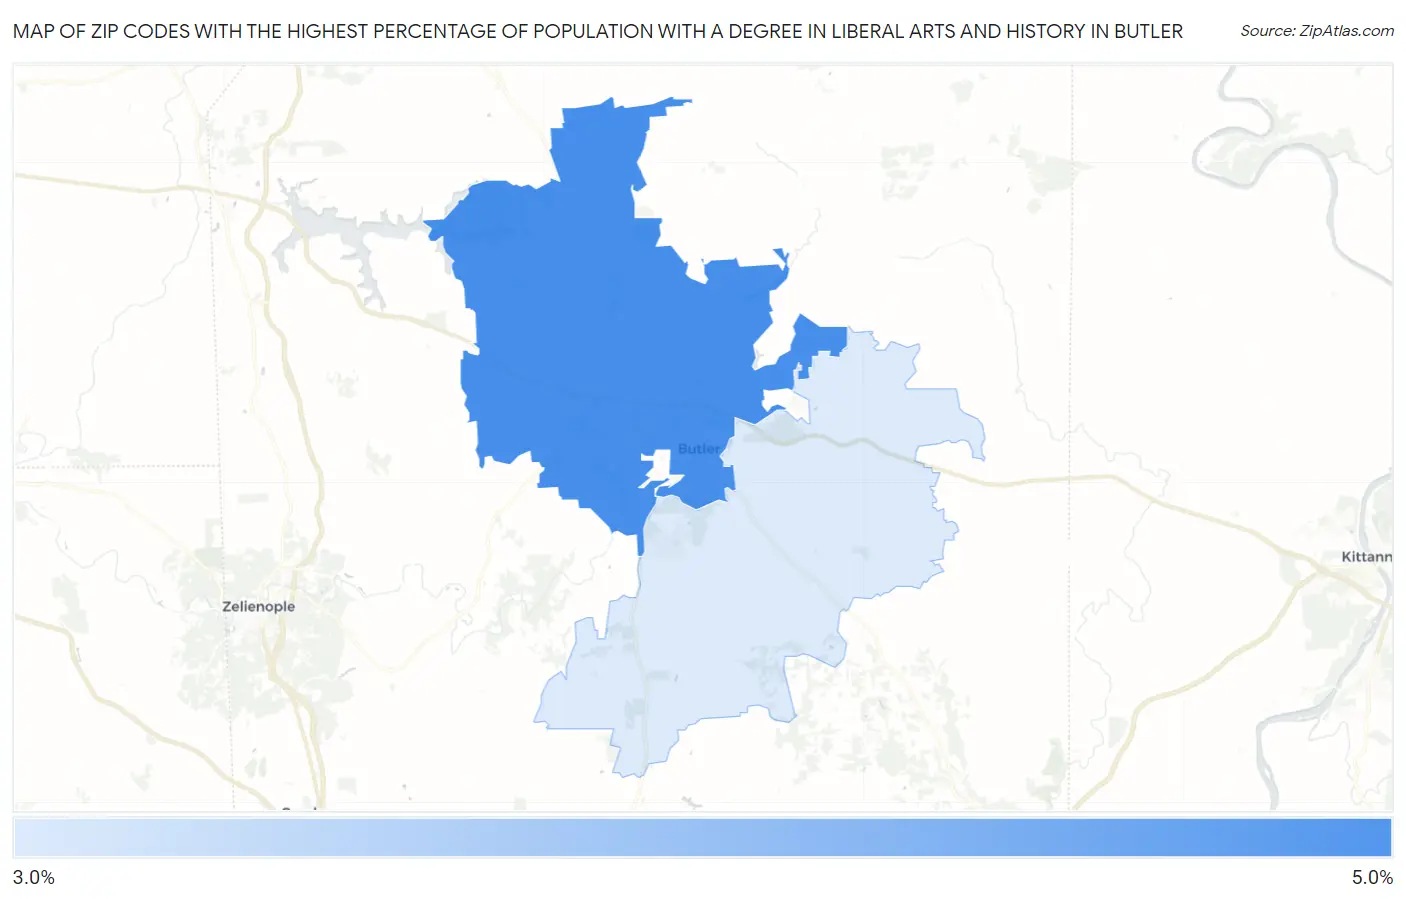
Map of Zip Codes with the Highest Percentage of Population with a Degree in Liberal Arts and History in Butler
0.0%
5.0%
Zip Codes with the Highest Percentage of Population with a Degree in Liberal Arts and History in Butler, PA
| Zip Code | % Graduates | vs State | vs National | |
| 1. | 16001 | 4.4% | 4.6%(-0.226)#675 | 4.9%(-0.488)#13,345 |
| 2. | 16002 | 3.8% | 4.6%(-0.787)#775 | 4.9%(-1.05)#15,433 |
1
Common Questions
What are the Top Zip Codes with the Highest Percentage of Population with a Degree in Liberal Arts and History in Butler, PA?
Top Zip Codes with the Highest Percentage of Population with a Degree in Liberal Arts and History in Butler, PA are:
What zip code has the Highest Percentage of Population with a Degree in Liberal Arts and History in Butler, PA?
16001 has the Highest Percentage of Population with a Degree in Liberal Arts and History in Butler, PA with 4.4%.
What is the Percentage of Population with a Degree in Liberal Arts and History in Butler, PA?
Percentage of Population with a Degree in Liberal Arts and History in Butler is 7.3%.
What is the Percentage of Population with a Degree in Liberal Arts and History in Pennsylvania?
Percentage of Population with a Degree in Liberal Arts and History in Pennsylvania is 4.6%.
What is the Percentage of Population with a Degree in Liberal Arts and History in the United States?
Percentage of Population with a Degree in Liberal Arts and History in the United States is 4.9%.