Zip Codes with the Highest Percentage of Population Employed in Arts, Media & Entertainment in Chambersburg, PA
RELATED REPORTS & OPTIONS
Arts, Media & Entertainment
Chambersburg
Compare Zip Codes
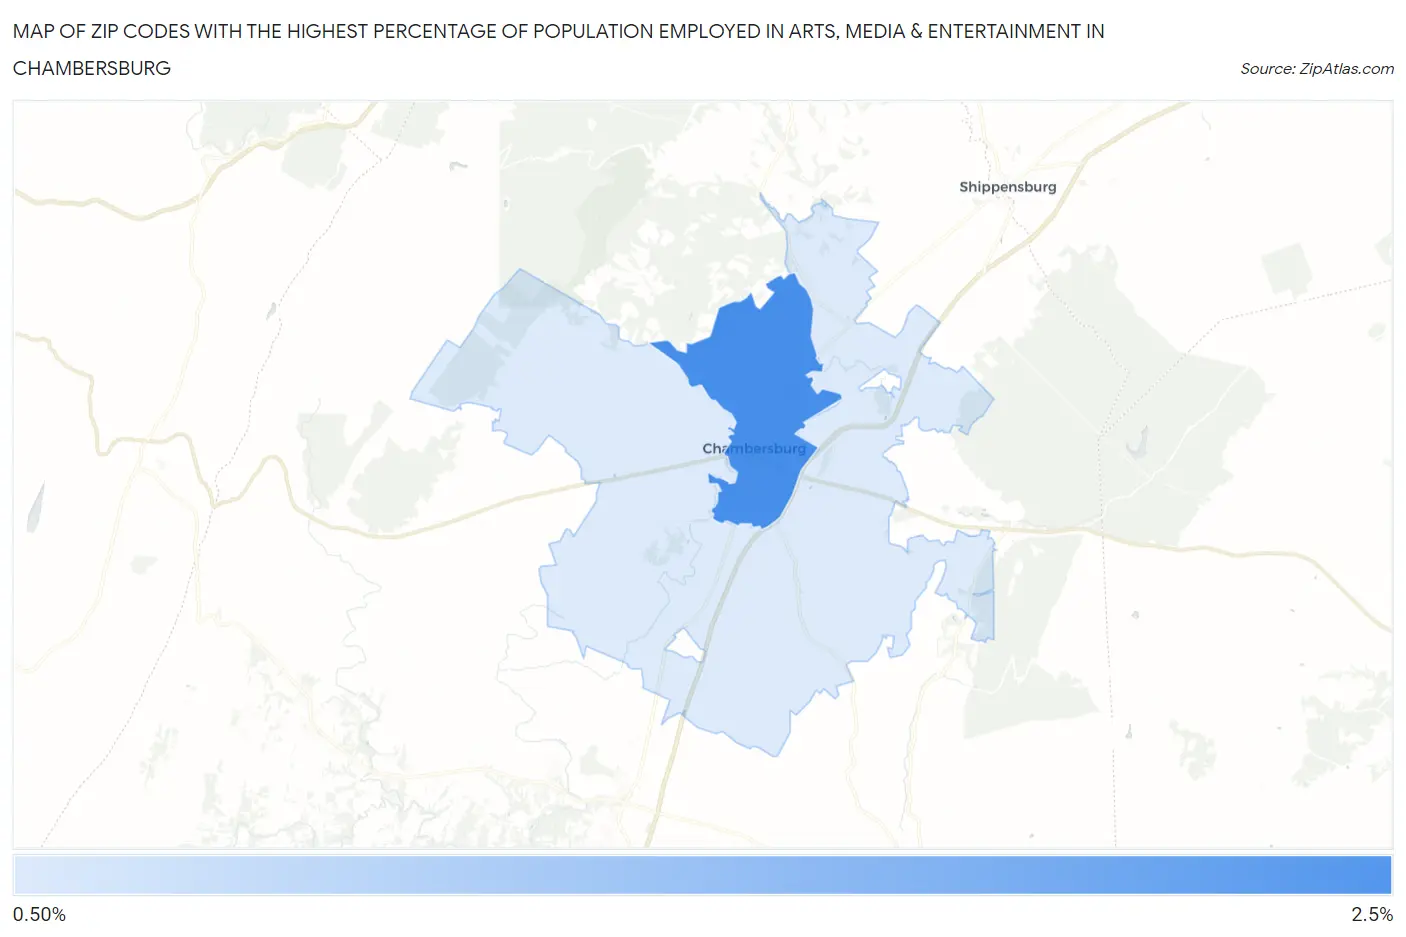
Map of Zip Codes with the Highest Percentage of Population Employed in Arts, Media & Entertainment in Chambersburg
0.0%
2.5%
Zip Codes with the Highest Percentage of Population Employed in Arts, Media & Entertainment in Chambersburg, PA
| Zip Code | % Employed | vs State | vs National | |
| 1. | 17201 | 2.4% | 1.8%(+0.611)#262 | 2.1%(+0.304)#6,070 |
| 2. | 17202 | 0.92% | 1.8%(-0.833)#798 | 2.1%(-1.14)#15,463 |
1
Common Questions
What are the Top Zip Codes with the Highest Percentage of Population Employed in Arts, Media & Entertainment in Chambersburg, PA?
Top Zip Codes with the Highest Percentage of Population Employed in Arts, Media & Entertainment in Chambersburg, PA are:
What zip code has the Highest Percentage of Population Employed in Arts, Media & Entertainment in Chambersburg, PA?
17201 has the Highest Percentage of Population Employed in Arts, Media & Entertainment in Chambersburg, PA with 2.4%.
What is the Percentage of Population Employed in Arts, Media & Entertainment in Pennsylvania?
Percentage of Population Employed in Arts, Media & Entertainment in Pennsylvania is 1.8%.
What is the Percentage of Population Employed in Arts, Media & Entertainment in the United States?
Percentage of Population Employed in Arts, Media & Entertainment in the United States is 2.1%.