Zip Codes with the Highest Percentage of Population Employed in Arts, Media & Entertainment in Lancaster, PA
RELATED REPORTS & OPTIONS
Arts, Media & Entertainment
Lancaster
Compare Zip Codes
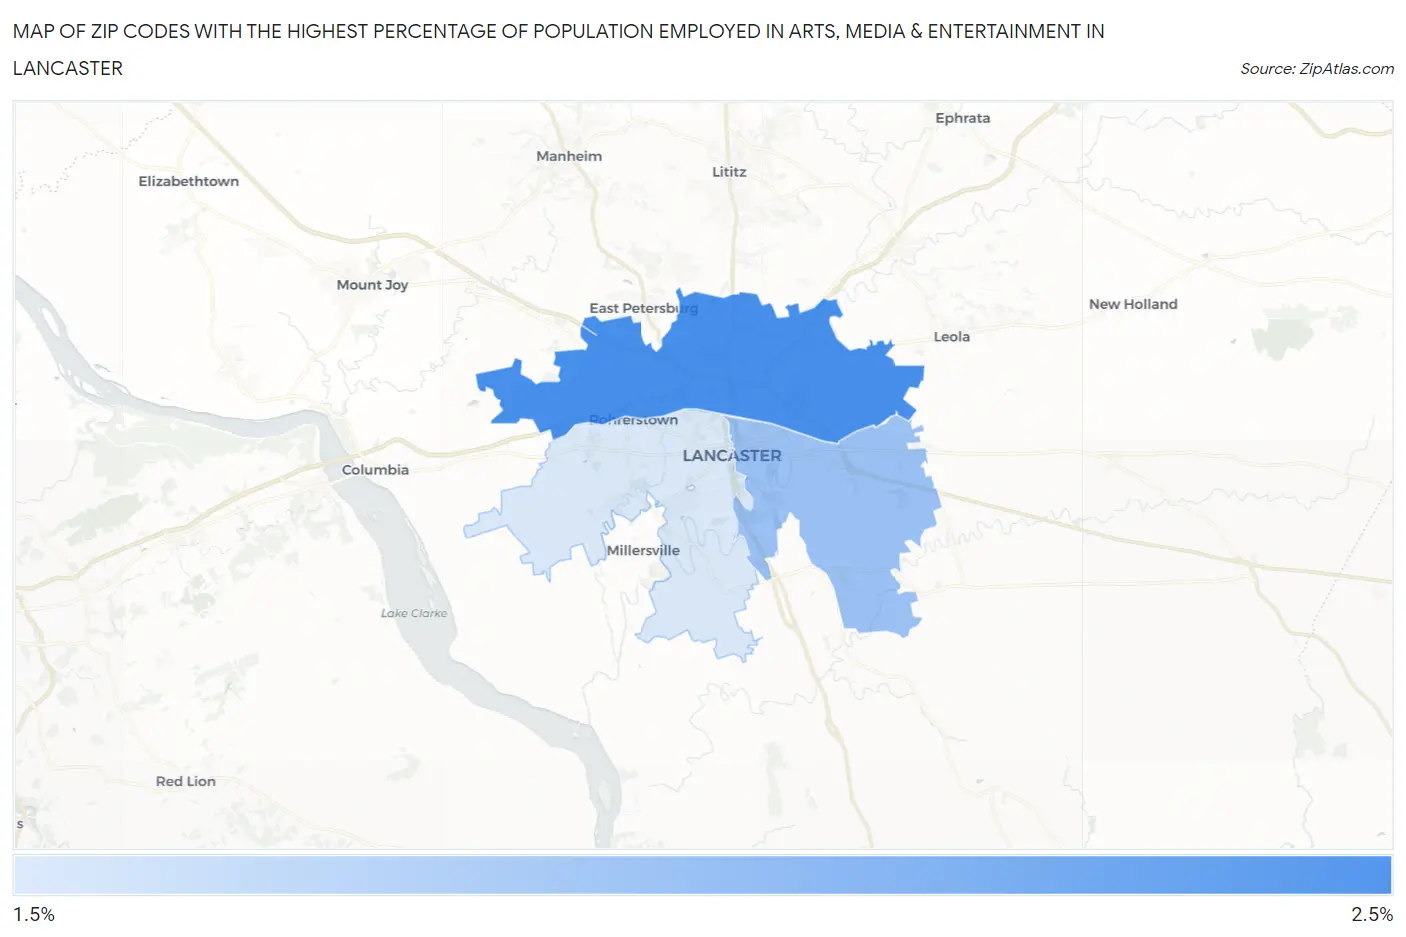
Map of Zip Codes with the Highest Percentage of Population Employed in Arts, Media & Entertainment in Lancaster
0.0%
2.5%
Zip Codes with the Highest Percentage of Population Employed in Arts, Media & Entertainment in Lancaster, PA
| Zip Code | % Employed | vs State | vs National | |
| 1. | 17601 | 2.5% | 1.8%(+0.701)#240 | 2.1%(+0.394)#5,707 |
| 2. | 17602 | 2.1% | 1.8%(+0.328)#329 | 2.1%(+0.020)#7,378 |
| 3. | 17603 | 1.8% | 1.8%(+0.045)#418 | 2.1%(-0.262)#8,982 |
1
Common Questions
What are the Top Zip Codes with the Highest Percentage of Population Employed in Arts, Media & Entertainment in Lancaster, PA?
Top Zip Codes with the Highest Percentage of Population Employed in Arts, Media & Entertainment in Lancaster, PA are:
What zip code has the Highest Percentage of Population Employed in Arts, Media & Entertainment in Lancaster, PA?
17601 has the Highest Percentage of Population Employed in Arts, Media & Entertainment in Lancaster, PA with 2.5%.
What is the Percentage of Population Employed in Arts, Media & Entertainment in Lancaster, PA?
Percentage of Population Employed in Arts, Media & Entertainment in Lancaster is 2.3%.
What is the Percentage of Population Employed in Arts, Media & Entertainment in Pennsylvania?
Percentage of Population Employed in Arts, Media & Entertainment in Pennsylvania is 1.8%.
What is the Percentage of Population Employed in Arts, Media & Entertainment in the United States?
Percentage of Population Employed in Arts, Media & Entertainment in the United States is 2.1%.