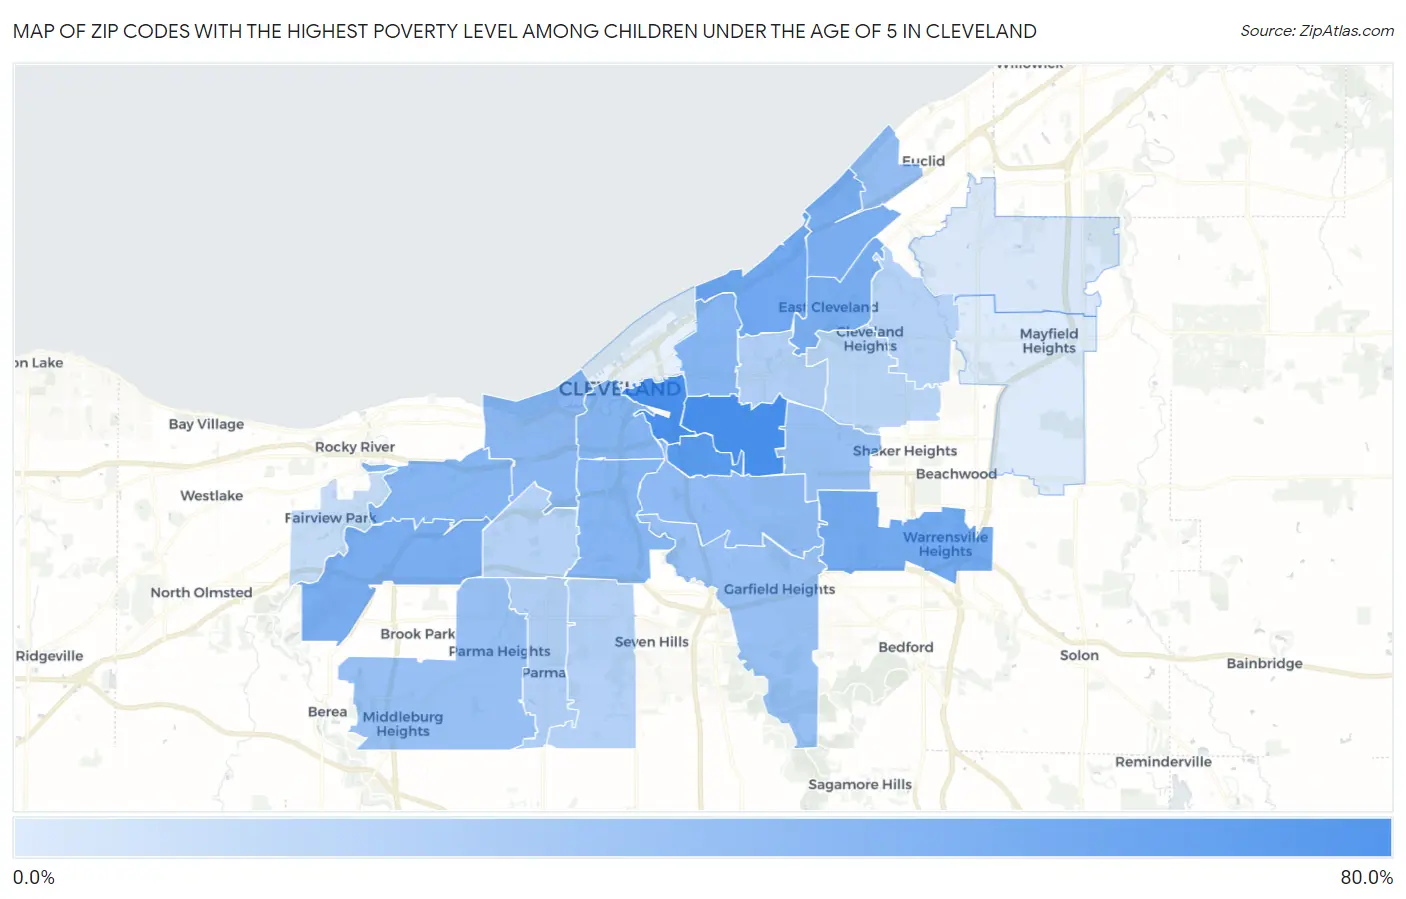
Zip Codes with the Highest Poverty Level Among Children Under the Age of 5 in Cleveland, OH
RELATED REPORTS & OPTIONS
Highest Poverty | Child 0-5
Cleveland
Compare Zip Codes
Map of Zip Codes with the Highest Poverty Level Among Children Under the Age of 5 in Cleveland
0.0%
80.0%
Zip Codes with the Highest Poverty Level Among Children Under the Age of 5 in Cleveland, OH
| Zip Code | Child Poverty | vs State | vs National | |
| 1. | 44104 | 78.3% | 20.7%(+57.6)#26 | 18.1%(+60.2)#863 |
| 2. | 44115 | 76.7% | 20.7%(+56.0)#29 | 18.1%(+58.6)#909 |
| 3. | 44127 | 68.2% | 20.7%(+47.5)#44 | 18.1%(+50.1)#1,221 |
| 4. | 44108 | 53.8% | 20.7%(+33.2)#81 | 18.1%(+35.8)#2,159 |
| 5. | 44128 | 52.7% | 20.7%(+32.1)#86 | 18.1%(+34.7)#2,276 |
| 6. | 44112 | 50.0% | 20.7%(+29.4)#97 | 18.1%(+32.0)#2,516 |
| 7. | 44110 | 48.1% | 20.7%(+27.4)#115 | 18.1%(+30.0)#2,803 |
| 8. | 44135 | 47.9% | 20.7%(+27.2)#118 | 18.1%(+29.8)#2,822 |
| 9. | 44109 | 42.7% | 20.7%(+22.0)#152 | 18.1%(+24.6)#3,536 |
| 10. | 44103 | 42.5% | 20.7%(+21.8)#154 | 18.1%(+24.4)#3,568 |
| 11. | 44111 | 42.1% | 20.7%(+21.4)#157 | 18.1%(+24.1)#3,637 |
| 12. | 44113 | 41.9% | 20.7%(+21.2)#159 | 18.1%(+23.8)#3,674 |
| 13. | 44102 | 39.5% | 20.7%(+18.8)#174 | 18.1%(+21.4)#4,119 |
| 14. | 44105 | 38.1% | 20.7%(+17.4)#183 | 18.1%(+20.0)#4,398 |
| 15. | 44119 | 35.8% | 20.7%(+15.1)#207 | 18.1%(+17.7)#4,866 |
| 16. | 44130 | 33.7% | 20.7%(+13.0)#237 | 18.1%(+15.6)#5,381 |
| 17. | 44125 | 33.2% | 20.7%(+12.5)#243 | 18.1%(+15.1)#5,551 |
| 18. | 44120 | 32.9% | 20.7%(+12.3)#245 | 18.1%(+14.9)#5,603 |
| 19. | 44129 | 23.1% | 20.7%(+2.41)#361 | 18.1%(+5.01)#8,729 |
| 20. | 44106 | 22.7% | 20.7%(+2.07)#369 | 18.1%(+4.67)#8,865 |
| 21. | 44134 | 20.1% | 20.7%(-0.542)#407 | 18.1%(+2.06)#9,964 |
| 22. | 44144 | 19.6% | 20.7%(-1.03)#422 | 18.1%(+1.57)#10,211 |
| 23. | 44121 | 19.6% | 20.7%(-1.10)#424 | 18.1%(+1.50)#10,241 |
| 24. | 44118 | 17.7% | 20.7%(-2.97)#457 | 18.1%(-0.361)#11,104 |
| 25. | 44126 | 13.4% | 20.7%(-7.28)#550 | 18.1%(-4.68)#13,390 |
| 26. | 44143 | 5.7% | 20.7%(-15.0)#736 | 18.1%(-12.4)#18,286 |
| 27. | 44124 | 3.8% | 20.7%(-16.8)#788 | 18.1%(-14.2)#19,637 |
1
Common Questions
What are the Top 10 Zip Codes with the Highest Poverty Level Among Children Under the Age of 5 in Cleveland, OH?
Top 10 Zip Codes with the Highest Poverty Level Among Children Under the Age of 5 in Cleveland, OH are:
What zip code has the Highest Poverty Level Among Children Under the Age of 5 in Cleveland, OH?
44104 has the Highest Poverty Level Among Children Under the Age of 5 in Cleveland, OH with 78.3%.
What is the Poverty Level Among Children Under the Age of 5 in Cleveland, OH?
Poverty Level Among Children Under the Age of 5 in Cleveland is 48.8%.
What is the Poverty Level Among Children Under the Age of 5 in Ohio?
Poverty Level Among Children Under the Age of 5 in Ohio is 20.7%.
What is the Poverty Level Among Children Under the Age of 5 in the United States?
Poverty Level Among Children Under the Age of 5 in the United States is 18.1%.