Zip Codes with the Highest Percentage of Renter-Occupied Units in Chagrin Falls, OH
RELATED REPORTS & OPTIONS
Highest Renter-Occupied
Chagrin Falls
Compare Zip Codes
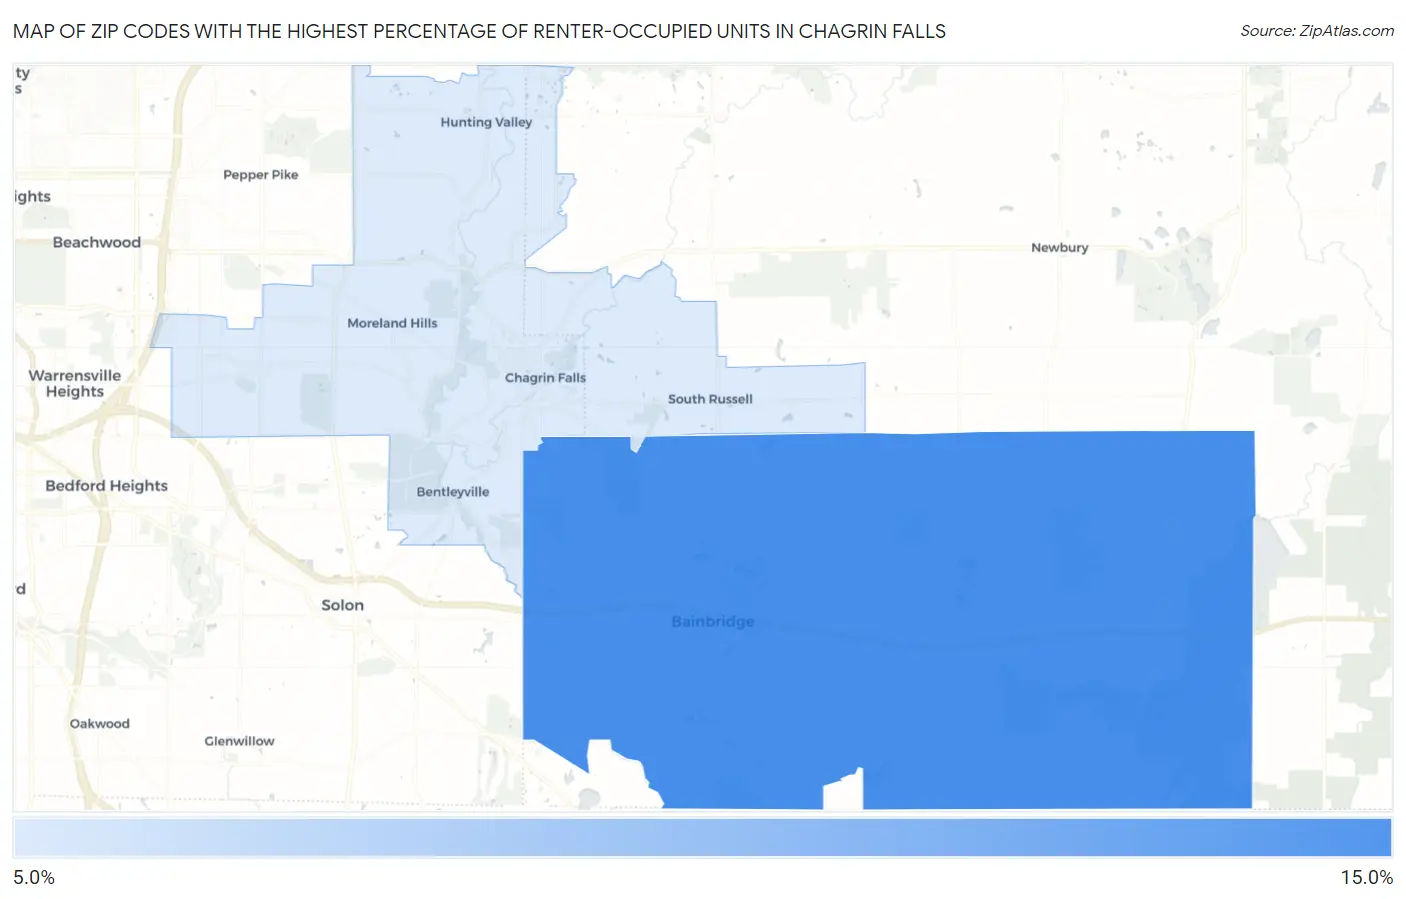
Map of Zip Codes with the Highest Percentage of Renter-Occupied Units in Chagrin Falls
0.0%
15.0%
Zip Codes with the Highest Percentage of Renter-Occupied Units in Chagrin Falls, OH
| Zip Code | % Renter-Occupied | vs State | vs National | |
| 1. | 44023 | 10.1% | 33.2%(-23.0)#1,033 | 35.2%(-25.0)#27,204 |
| 2. | 44022 | 9.7% | 33.2%(-23.5)#1,044 | 35.2%(-25.5)#27,526 |
1
Common Questions
What are the Top Zip Codes with the Highest Percentage of Renter-Occupied Units in Chagrin Falls, OH?
Top Zip Codes with the Highest Percentage of Renter-Occupied Units in Chagrin Falls, OH are:
What zip code has the Highest Percentage of Renter-Occupied Units in Chagrin Falls, OH?
44023 has the Highest Percentage of Renter-Occupied Units in Chagrin Falls, OH with 10.1%.
What is the Percentage of Renter-Occupied Units in Chagrin Falls, OH?
Percentage of Renter-Occupied Units in Chagrin Falls is 20.2%.
What is the Percentage of Renter-Occupied Units in Ohio?
Percentage of Renter-Occupied Units in Ohio is 33.2%.
What is the Percentage of Renter-Occupied Units in the United States?
Percentage of Renter-Occupied Units in the United States is 35.2%.