Chamberino, NM
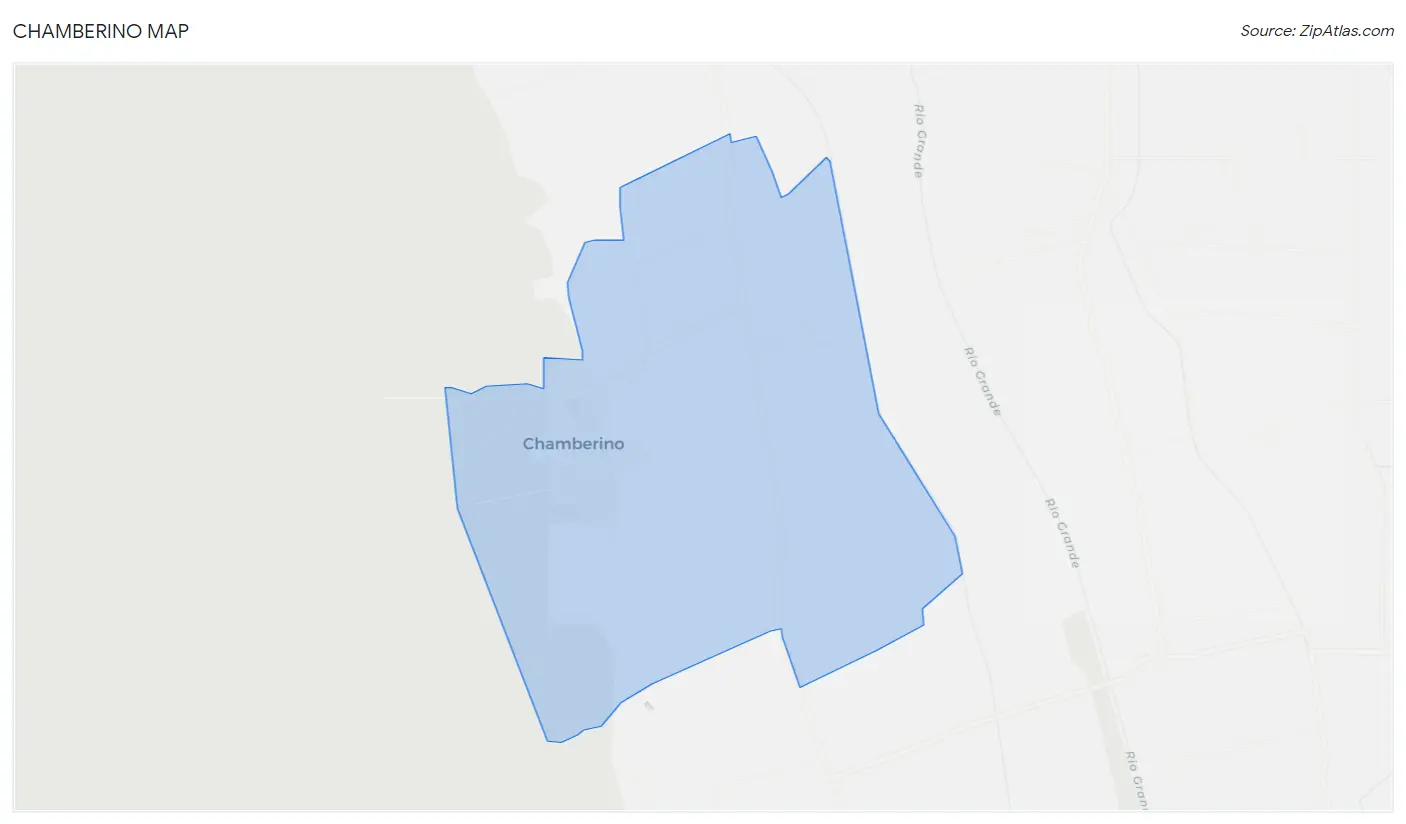
Chamberino Map
Chamberino Overview
720
TOTAL POPULATION
376
MALE POPULATION
344
FEMALE POPULATION
109.30
MALES / 100 FEMALES
91.49
FEMALES / 100 MALES
34.5
MEDIAN AGE
3.7
AVG FAMILY SIZE
3.0
AVG HOUSEHOLD SIZE
$23,887
PER CAPITA INCOME
$76,438
AVG FAMILY INCOME
0.48
INEQUALITY / GINI INDEX
317
LABOR FORCE [ PEOPLE ]
57.1%
PERCENT IN LABOR FORCE
4.7%
UNEMPLOYMENT RATE
Chamberino Zip Codes
Chamberino Area Codes
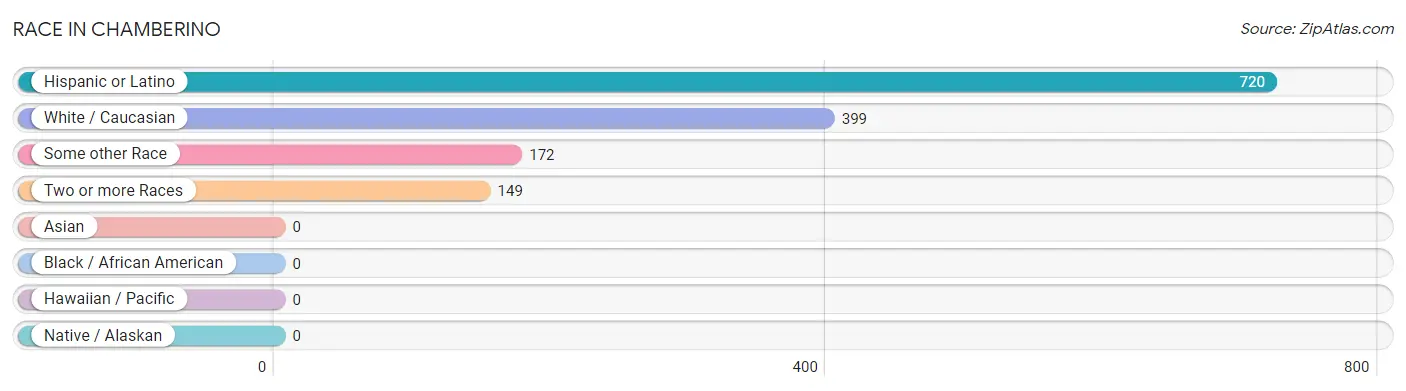
Race in Chamberino
The most populous races in Chamberino are Hispanic or Latino (720 | 100.0%), White / Caucasian (399 | 55.4%), and Some other Race (172 | 23.9%).
| Race | # Population | % Population |
| Asian | 0 | 0.0% |
| Black / African American | 0 | 0.0% |
| Hawaiian / Pacific | 0 | 0.0% |
| Hispanic or Latino | 720 | 100.0% |
| Native / Alaskan | 0 | 0.0% |
| White / Caucasian | 399 | 55.4% |
| Two or more Races | 149 | 20.7% |
| Some other Race | 172 | 23.9% |
| Total | 720 | 100.0% |
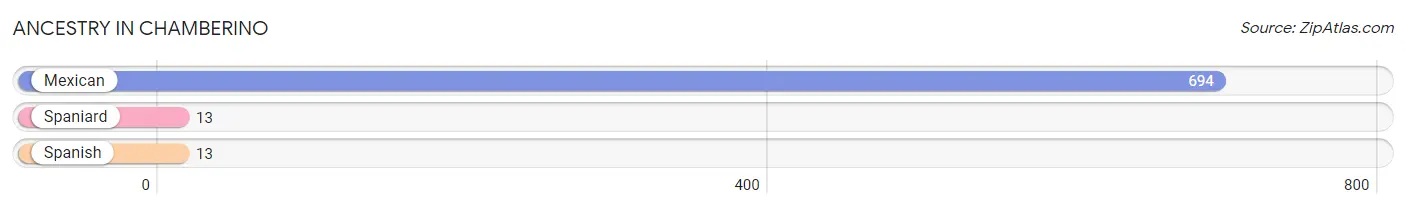
Ancestry in Chamberino
The most populous ancestries reported in Chamberino are Mexican (694 | 96.4%), Spaniard (13 | 1.8%), and Spanish (13 | 1.8%), together accounting for 100.0% of all Chamberino residents.
| Ancestry | # Population | % Population |
| Mexican | 694 | 96.4% |
| Spaniard | 13 | 1.8% |
| Spanish | 13 | 1.8% | View All 3 Rows |
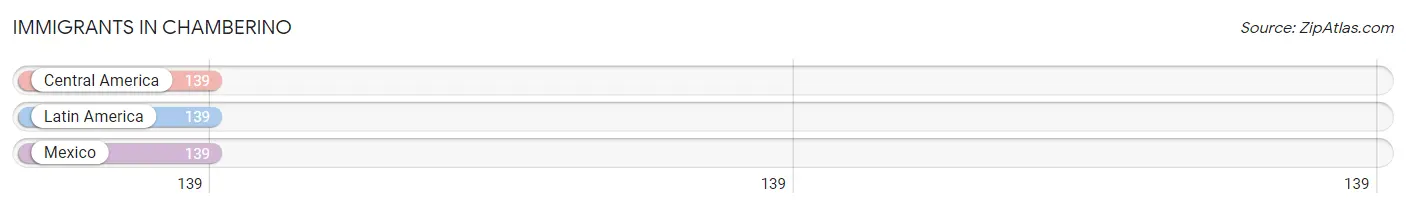
Immigrants in Chamberino
The most numerous immigrant groups reported in Chamberino came from Central America (139 | 19.3%), Latin America (139 | 19.3%), and Mexico (139 | 19.3%), together accounting for 57.9% of all Chamberino residents.
| Immigration Origin | # Population | % Population |
| Central America | 139 | 19.3% |
| Latin America | 139 | 19.3% |
| Mexico | 139 | 19.3% | View All 3 Rows |
Sex and Age in Chamberino
Sex and Age in Chamberino
The most populous age groups in Chamberino are 5 to 9 Years (60 | 16.0%) for men and 65 to 69 Years (44 | 12.8%) for women.
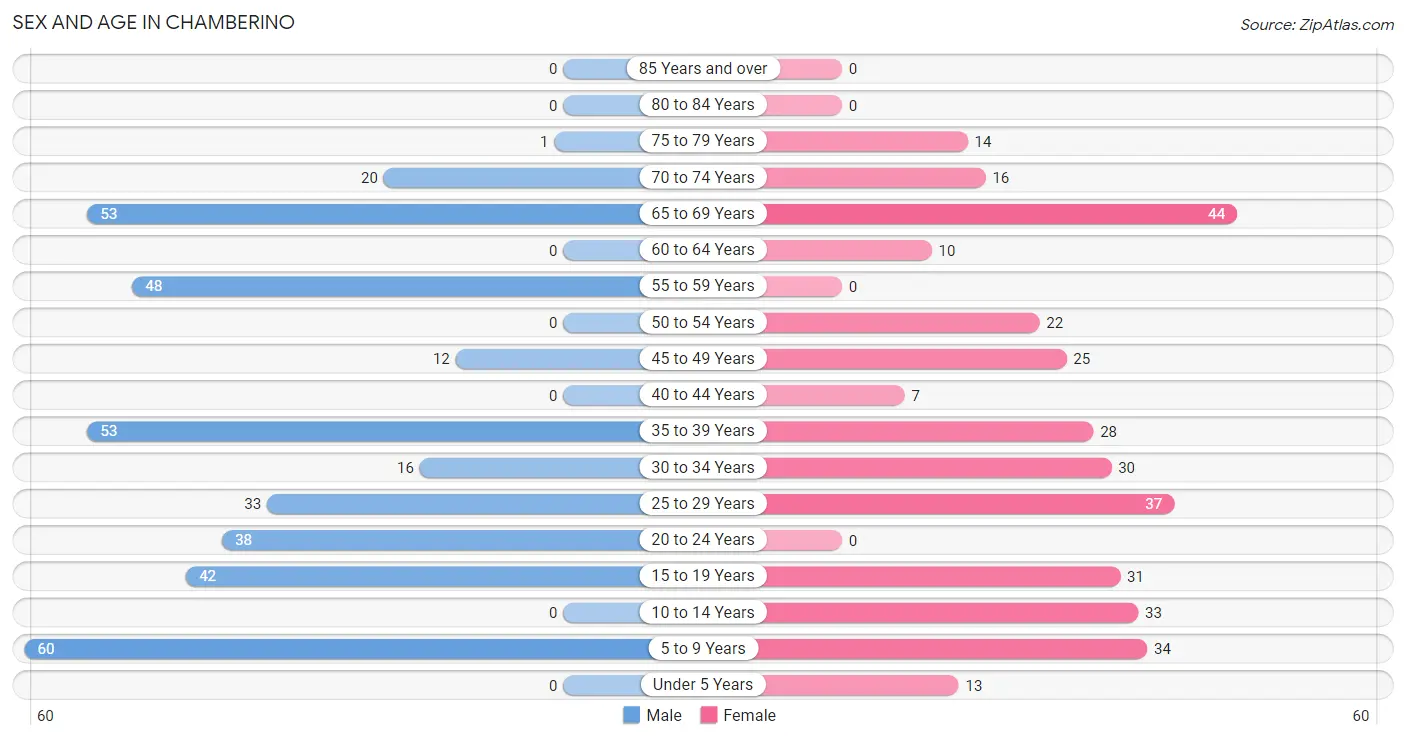
| Age Bracket | Male | Female |
| Under 5 Years | 0 (0.0%) | 13 (3.8%) |
| 5 to 9 Years | 60 (16.0%) | 34 (9.9%) |
| 10 to 14 Years | 0 (0.0%) | 33 (9.6%) |
| 15 to 19 Years | 42 (11.2%) | 31 (9.0%) |
| 20 to 24 Years | 38 (10.1%) | 0 (0.0%) |
| 25 to 29 Years | 33 (8.8%) | 37 (10.8%) |
| 30 to 34 Years | 16 (4.3%) | 30 (8.7%) |
| 35 to 39 Years | 53 (14.1%) | 28 (8.1%) |
| 40 to 44 Years | 0 (0.0%) | 7 (2.0%) |
| 45 to 49 Years | 12 (3.2%) | 25 (7.3%) |
| 50 to 54 Years | 0 (0.0%) | 22 (6.4%) |
| 55 to 59 Years | 48 (12.8%) | 0 (0.0%) |
| 60 to 64 Years | 0 (0.0%) | 10 (2.9%) |
| 65 to 69 Years | 53 (14.1%) | 44 (12.8%) |
| 70 to 74 Years | 20 (5.3%) | 16 (4.6%) |
| 75 to 79 Years | 1 (0.3%) | 14 (4.1%) |
| 80 to 84 Years | 0 (0.0%) | 0 (0.0%) |
| 85 Years and over | 0 (0.0%) | 0 (0.0%) |
| Total | 376 (100.0%) | 344 (100.0%) |
Families and Households in Chamberino
Median Family Size in Chamberino
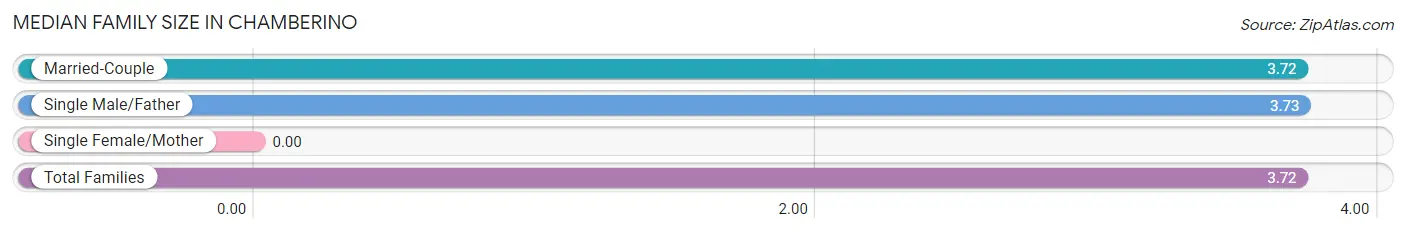
| Family Type | # Families | Family Size |
| Married-Couple | 159 (93.5%) | 3.72 |
| Single Male/Father | 11 (6.5%) | 3.73 |
| Single Female/Mother | 0 (0.0%) | - |
| Total Families | 170 (100.0%) | 3.72 |
Median Household Size in Chamberino
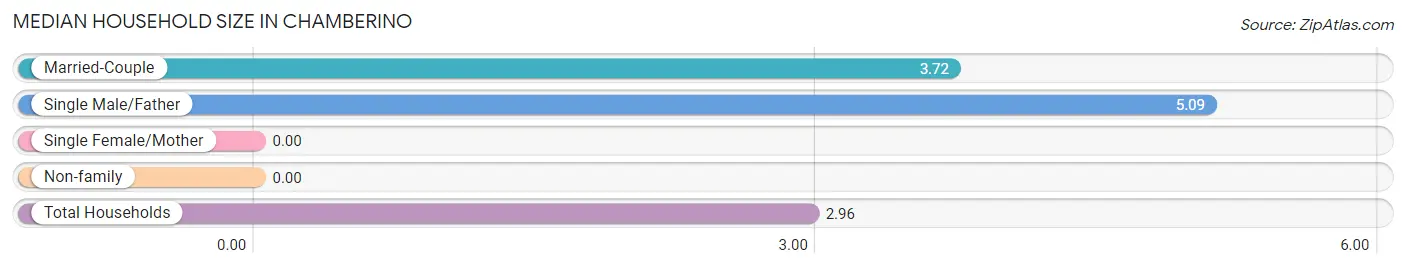
| Household Type | # Households | Household Size |
| Married-Couple | 159 (65.4%) | 3.72 |
| Single Male/Father | 11 (4.5%) | 5.09 |
| Single Female/Mother | 0 (0.0%) | - |
| Non-family | 73 (30.0%) | - |
| Total Households | 243 (100.0%) | 2.96 |
Household Size by Marriage Status in Chamberino
Out of a total of 243 households in Chamberino, 170 (70.0%) are family households, while 73 (30.0%) are nonfamily households. The most numerous type of family households are 3-person households, comprising 59, and the most common type of nonfamily households are 1-person households, comprising 73.
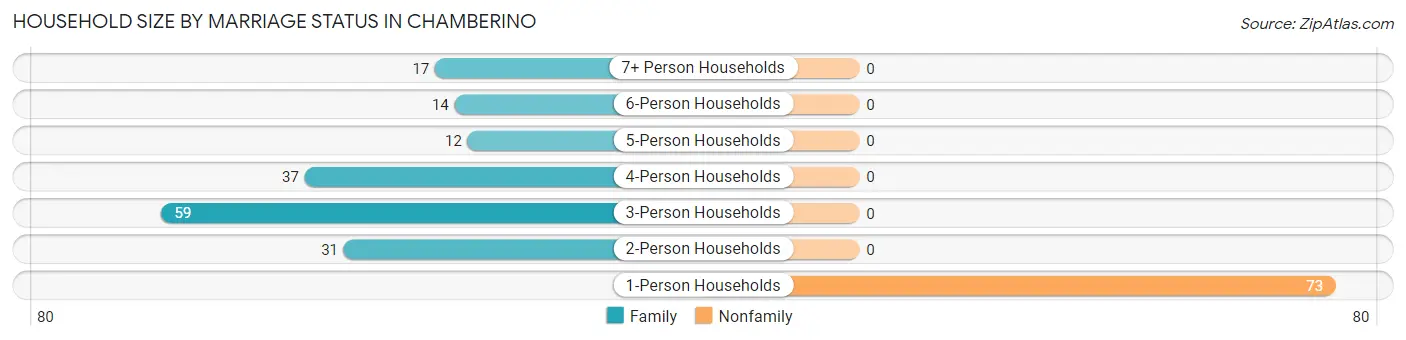
| Household Size | Family Households | Nonfamily Households |
| 1-Person Households | - | 73 (30.0%) |
| 2-Person Households | 31 (12.8%) | 0 (0.0%) |
| 3-Person Households | 59 (24.3%) | 0 (0.0%) |
| 4-Person Households | 37 (15.2%) | 0 (0.0%) |
| 5-Person Households | 12 (4.9%) | 0 (0.0%) |
| 6-Person Households | 14 (5.8%) | 0 (0.0%) |
| 7+ Person Households | 17 (7.0%) | 0 (0.0%) |
| Total | 170 (70.0%) | 73 (30.0%) |
Female Fertility in Chamberino
Fertility by Age in Chamberino
Average fertility rate in Chamberino is 101.0 births per 1,000 women. Women in the age bracket of 20 to 34 years have the highest fertility rate with 254.0 births per 1,000 women. Women in the age bracket of 20 to 34 years acount for 100.0% of all women with births.
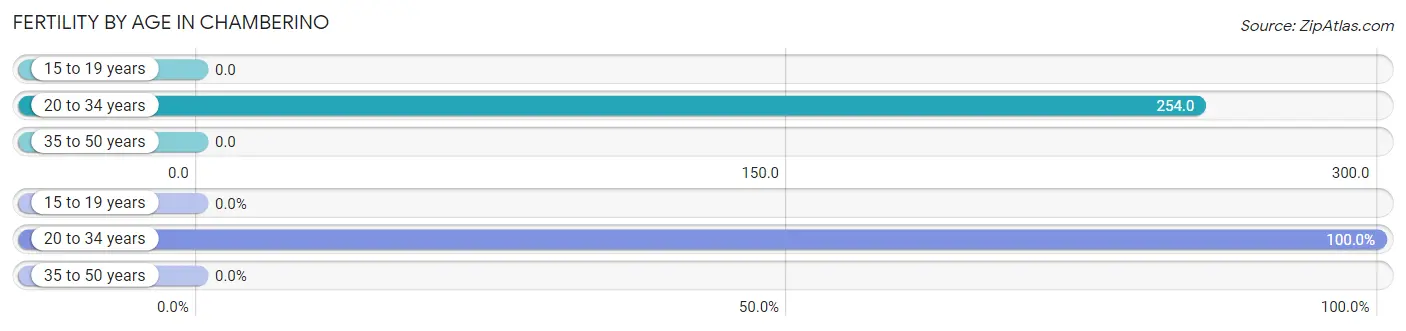
| Age Bracket | Women with Births | Births / 1,000 Women |
| 15 to 19 years | 0 (0.0%) | 0.0 |
| 20 to 34 years | 17 (100.0%) | 254.0 |
| 35 to 50 years | 0 (0.0%) | 0.0 |
| Total | 17 (100.0%) | 101.0 |
Fertility by Age by Marriage Status in Chamberino
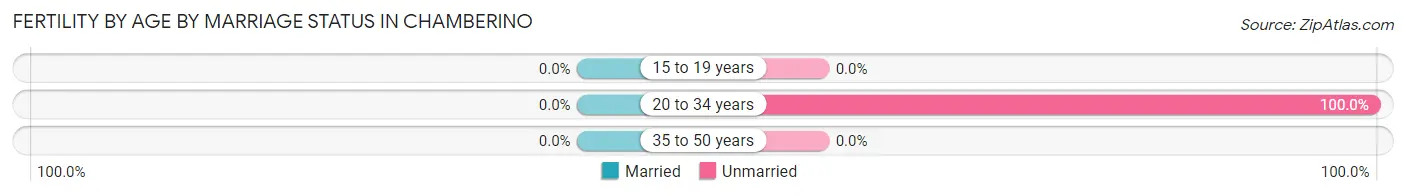
| Age Bracket | Married | Unmarried |
| 15 to 19 years | 0 (0.0%) | 0 (0.0%) |
| 20 to 34 years | 0 (0.0%) | 17 (100.0%) |
| 35 to 50 years | 0 (0.0%) | 0 (0.0%) |
| Total | 0 (0.0%) | 17 (100.0%) |
Fertility by Education in Chamberino
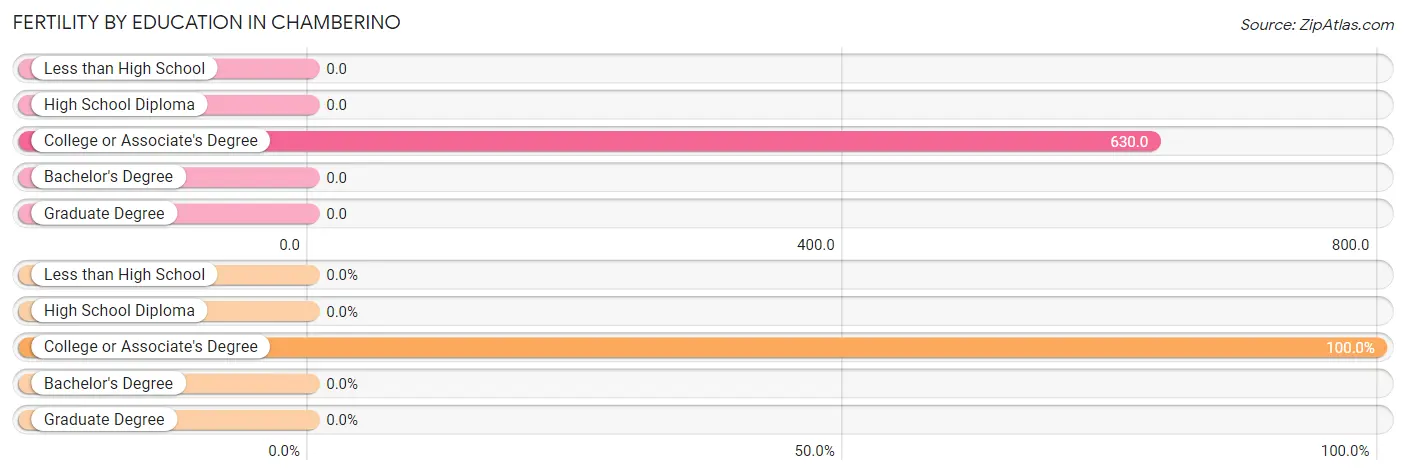
| Educational Attainment | Women with Births | Births / 1,000 Women |
| Less than High School | 0 (0.0%) | 0.0 |
| High School Diploma | 0 (0.0%) | 0.0 |
| College or Associate's Degree | 17 (100.0%) | 630.0 |
| Bachelor's Degree | 0 (0.0%) | 0.0 |
| Graduate Degree | 0 (0.0%) | 0.0 |
| Total | 17 (100.0%) | 101.0 |
Fertility by Education by Marriage Status in Chamberino
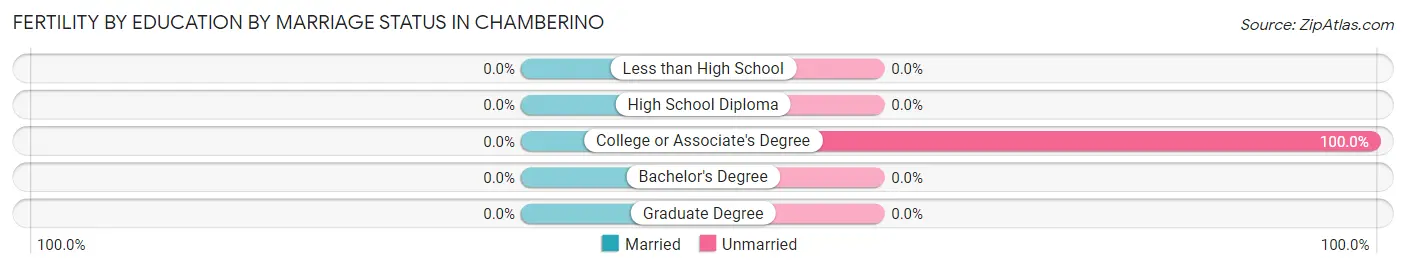
| Educational Attainment | Married | Unmarried |
| Less than High School | 0 (0.0%) | 0 (0.0%) |
| High School Diploma | 0 (0.0%) | 0 (0.0%) |
| College or Associate's Degree | 0 (0.0%) | 17 (100.0%) |
| Bachelor's Degree | 0 (0.0%) | 0 (0.0%) |
| Graduate Degree | 0 (0.0%) | 0 (0.0%) |
| Total | 0 (0.0%) | 17 (100.0%) |
Income in Chamberino
Income Overview in Chamberino
| Characteristic | Number | Measure |
| Per Capita Income | 720 | $23,887 |
| Median Family Income | 170 | $76,438 |
| Mean Family Income | 170 | $91,406 |
| Median Household Income | 243 | $0 |
| Mean Household Income | 243 | $70,113 |
| Income Deficit | 170 | $0 |
| Wage / Income Gap (%) | 720 | 0.00% |
| Wage / Income Gap ($) | 720 | 100.00¢ per $1 |
| Gini / Inequality Index | 720 | 0.48 |
Earnings by Sex in Chamberino
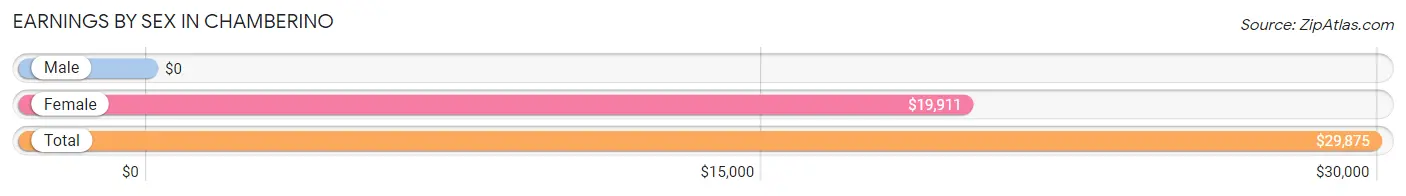
| Sex | Number | Average Earnings |
| Male | 229 (61.2%) | $0 |
| Female | 145 (38.8%) | $19,911 |
| Total | 374 (100.0%) | $29,875 |
Earnings by Sex by Income Bracket in Chamberino
The most common earnings brackets in Chamberino are $25,000 to $29,999 for men (40 | 17.5%) and $15,000 to $17,499 for women (27 | 18.6%).
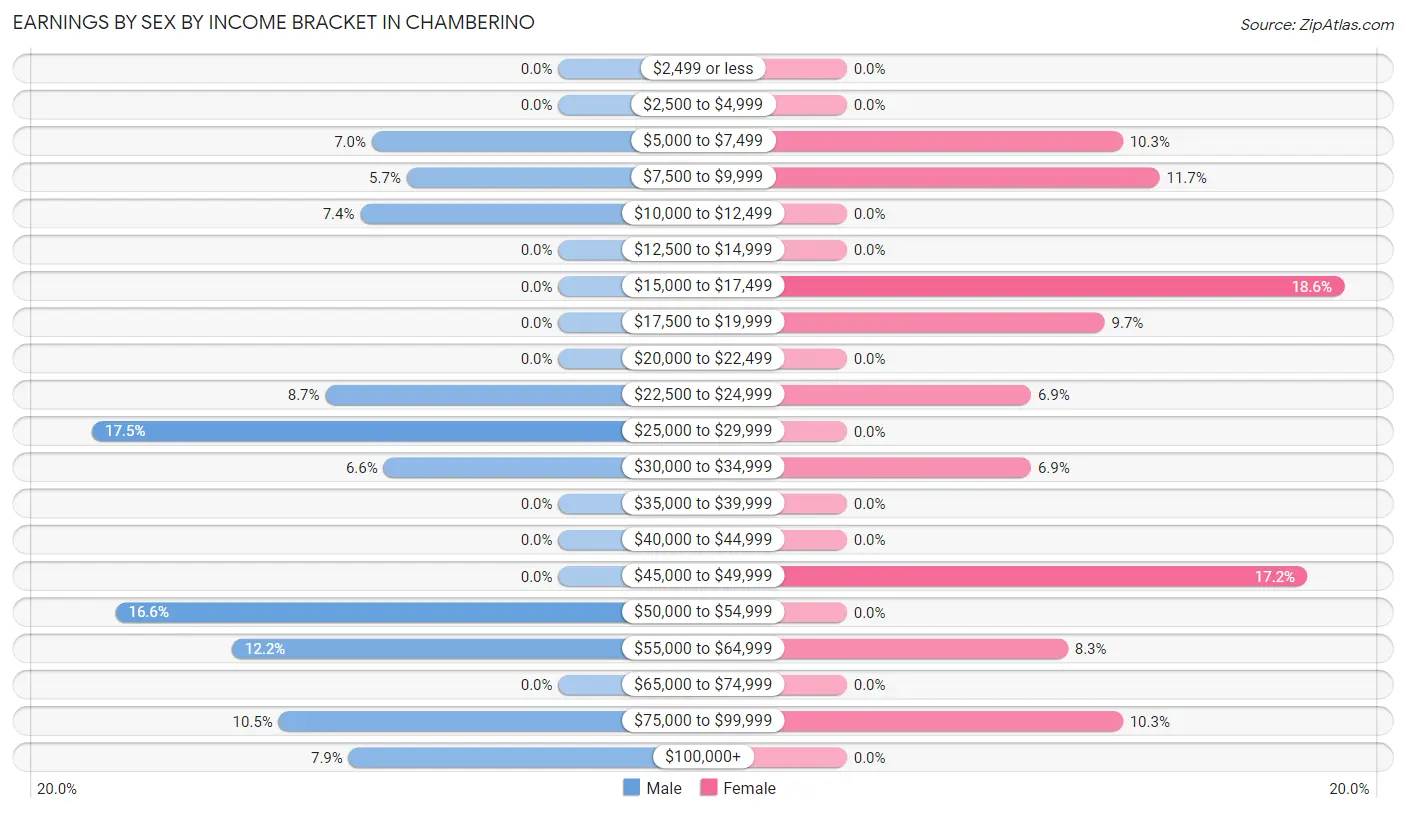
| Income | Male | Female |
| $2,499 or less | 0 (0.0%) | 0 (0.0%) |
| $2,500 to $4,999 | 0 (0.0%) | 0 (0.0%) |
| $5,000 to $7,499 | 16 (7.0%) | 15 (10.3%) |
| $7,500 to $9,999 | 13 (5.7%) | 17 (11.7%) |
| $10,000 to $12,499 | 17 (7.4%) | 0 (0.0%) |
| $12,500 to $14,999 | 0 (0.0%) | 0 (0.0%) |
| $15,000 to $17,499 | 0 (0.0%) | 27 (18.6%) |
| $17,500 to $19,999 | 0 (0.0%) | 14 (9.7%) |
| $20,000 to $22,499 | 0 (0.0%) | 0 (0.0%) |
| $22,500 to $24,999 | 20 (8.7%) | 10 (6.9%) |
| $25,000 to $29,999 | 40 (17.5%) | 0 (0.0%) |
| $30,000 to $34,999 | 15 (6.6%) | 10 (6.9%) |
| $35,000 to $39,999 | 0 (0.0%) | 0 (0.0%) |
| $40,000 to $44,999 | 0 (0.0%) | 0 (0.0%) |
| $45,000 to $49,999 | 0 (0.0%) | 25 (17.2%) |
| $50,000 to $54,999 | 38 (16.6%) | 0 (0.0%) |
| $55,000 to $64,999 | 28 (12.2%) | 12 (8.3%) |
| $65,000 to $74,999 | 0 (0.0%) | 0 (0.0%) |
| $75,000 to $99,999 | 24 (10.5%) | 15 (10.3%) |
| $100,000+ | 18 (7.9%) | 0 (0.0%) |
| Total | 229 (100.0%) | 145 (100.0%) |
Earnings by Sex by Educational Attainment in Chamberino
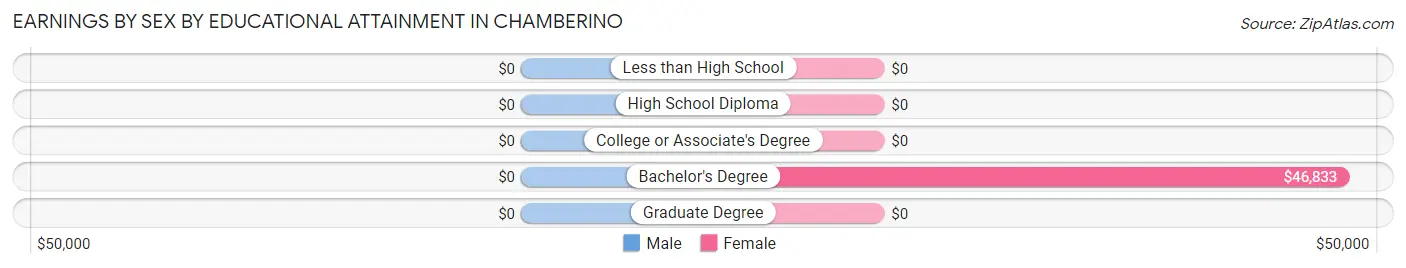
| Educational Attainment | Male Income | Female Income |
| Less than High School | - | - |
| High School Diploma | - | - |
| College or Associate's Degree | - | - |
| Bachelor's Degree | - | - |
| Graduate Degree | - | - |
| Total | $33,750 | $19,911 |
Family Income in Chamberino
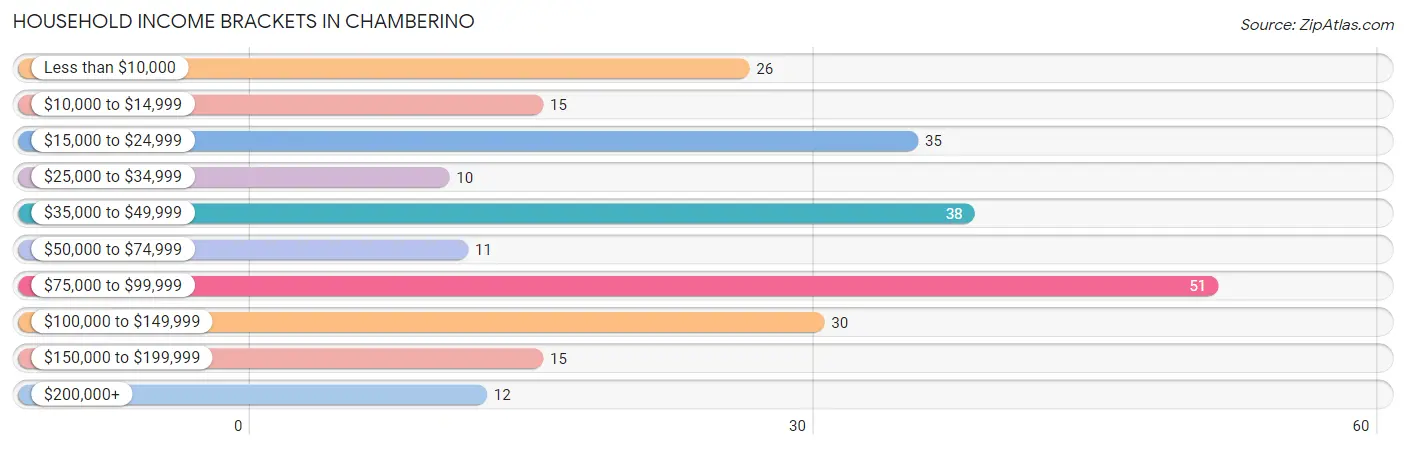
Family Income Brackets in Chamberino
According to the Chamberino family income data, there are 51 families falling into the $75,000 to $99,999 income range, which is the most common income bracket and makes up 30.0% of all families.
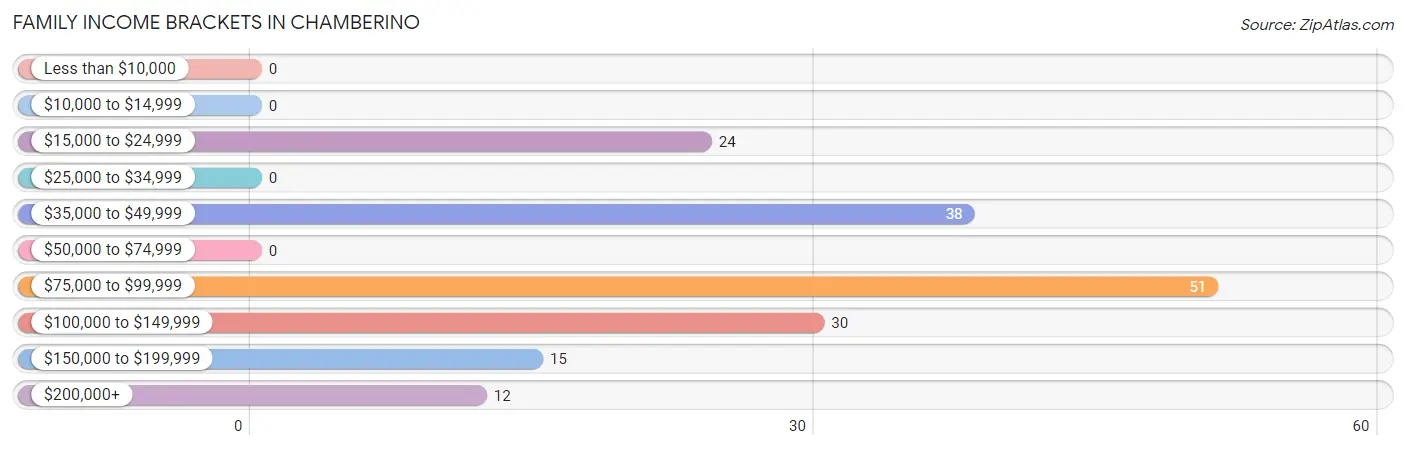
| Income Bracket | # Families | % Families |
| Less than $10,000 | 0 | 0.0% |
| $10,000 to $14,999 | 0 | 0.0% |
| $15,000 to $24,999 | 24 | 14.1% |
| $25,000 to $34,999 | 0 | 0.0% |
| $35,000 to $49,999 | 38 | 22.4% |
| $50,000 to $74,999 | 0 | 0.0% |
| $75,000 to $99,999 | 51 | 30.0% |
| $100,000 to $149,999 | 30 | 17.6% |
| $150,000 to $199,999 | 15 | 8.8% |
| $200,000+ | 12 | 7.1% |
Family Income by Famaliy Size in Chamberino
3-person families (70 | 41.2%) account for the highest median family income in Chamberino with $76,063 per family, while 3-person families (70 | 41.2%) have the highest median income of $25,354 per family member.
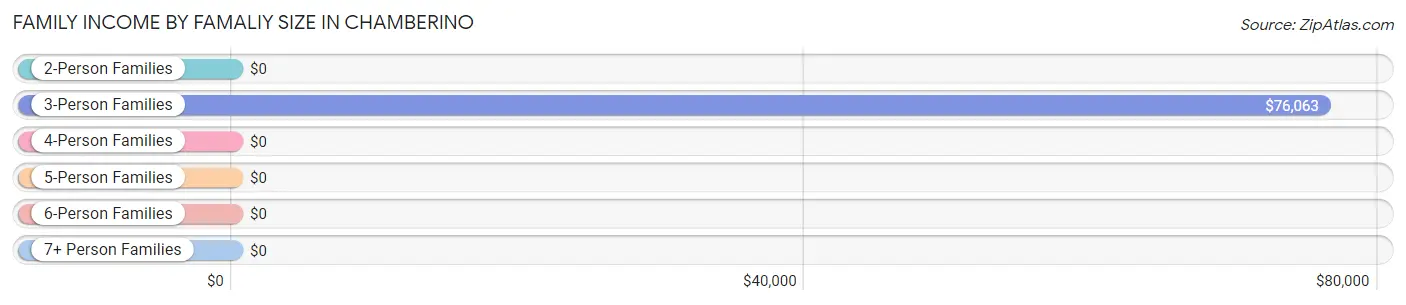
| Income Bracket | # Families | Median Income |
| 2-Person Families | 31 (18.2%) | $0 |
| 3-Person Families | 70 (41.2%) | $76,063 |
| 4-Person Families | 26 (15.3%) | $0 |
| 5-Person Families | 12 (7.1%) | $0 |
| 6-Person Families | 14 (8.2%) | $0 |
| 7+ Person Families | 17 (10.0%) | $0 |
| Total | 170 (100.0%) | $76,438 |
Family Income by Number of Earners in Chamberino
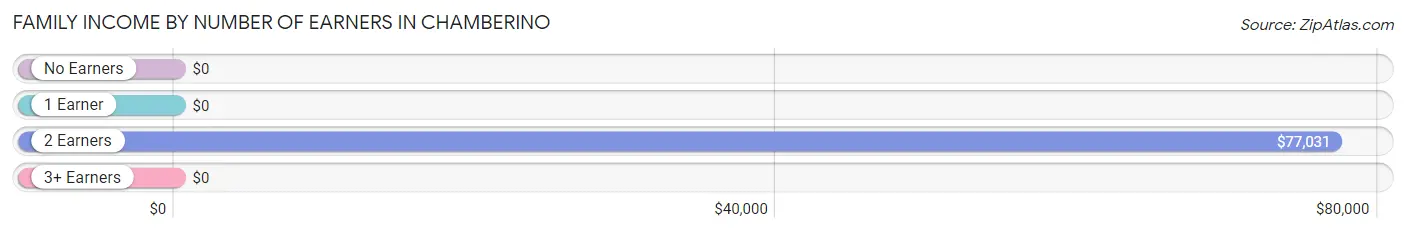
| Number of Earners | # Families | Median Income |
| No Earners | 13 (7.6%) | $0 |
| 1 Earner | 18 (10.6%) | $0 |
| 2 Earners | 127 (74.7%) | $77,031 |
| 3+ Earners | 12 (7.1%) | $0 |
| Total | 170 (100.0%) | $76,438 |
Household Income in Chamberino
Household Income Brackets in Chamberino
With 51 households falling in the category, the $75,000 to $99,999 income range is the most frequent in Chamberino, accounting for 21.0% of all households. In contrast, only 10 households (4.1%) fall into the $25,000 to $34,999 income bracket, making it the least populous group.
| Income Bracket | # Households | % Households |
| Less than $10,000 | 26 | 10.7% |
| $10,000 to $14,999 | 15 | 6.2% |
| $15,000 to $24,999 | 35 | 14.4% |
| $25,000 to $34,999 | 10 | 4.1% |
| $35,000 to $49,999 | 38 | 15.6% |
| $50,000 to $74,999 | 11 | 4.5% |
| $75,000 to $99,999 | 51 | 21.0% |
| $100,000 to $149,999 | 30 | 12.3% |
| $150,000 to $199,999 | 15 | 6.2% |
| $200,000+ | 12 | 4.9% |
Household Income by Householder Age in Chamberino
| Income Bracket | # Households | Median Income |
| 15 to 24 Years | 0 (0.0%) | $0 |
| 25 to 44 Years | 64 (26.3%) | $0 |
| 45 to 64 Years | 79 (32.5%) | $0 |
| 65+ Years | 100 (41.1%) | $0 |
| Total | 243 (100.0%) | $0 |
Poverty in Chamberino
Income Below Poverty by Sex and Age in Chamberino
With 22.1% poverty level for males and 39.5% for females among the residents of Chamberino, 75 year old and over males and under 5 year old females are the most vulnerable to poverty, with 1 males (100.0%) and 13 females (100.0%) in their respective age groups living below the poverty level.
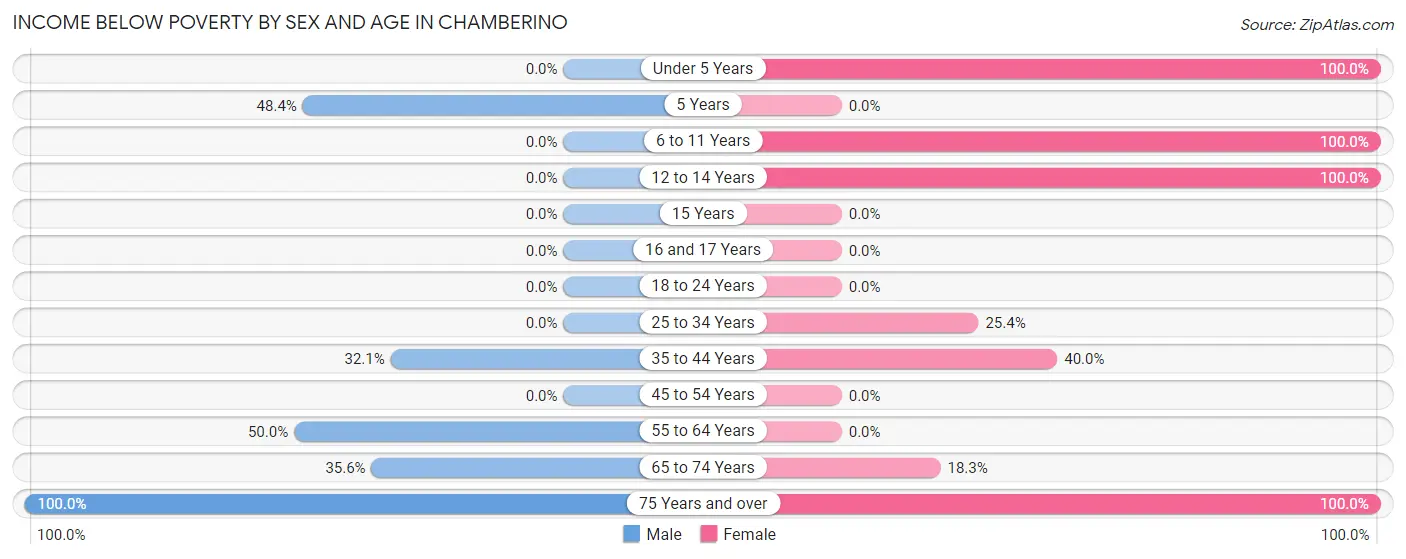
| Age Bracket | Male | Female |
| Under 5 Years | 0 (0.0%) | 13 (100.0%) |
| 5 Years | 15 (48.4%) | 0 (0.0%) |
| 6 to 11 Years | 0 (0.0%) | 34 (100.0%) |
| 12 to 14 Years | 0 (0.0%) | 33 (100.0%) |
| 15 Years | 0 (0.0%) | 0 (0.0%) |
| 16 and 17 Years | 0 (0.0%) | 0 (0.0%) |
| 18 to 24 Years | 0 (0.0%) | 0 (0.0%) |
| 25 to 34 Years | 0 (0.0%) | 17 (25.4%) |
| 35 to 44 Years | 17 (32.1%) | 14 (40.0%) |
| 45 to 54 Years | 0 (0.0%) | 0 (0.0%) |
| 55 to 64 Years | 24 (50.0%) | 0 (0.0%) |
| 65 to 74 Years | 26 (35.6%) | 11 (18.3%) |
| 75 Years and over | 1 (100.0%) | 14 (100.0%) |
| Total | 83 (22.1%) | 136 (39.5%) |
Income Above Poverty by Sex and Age in Chamberino
According to the poverty statistics in Chamberino, males aged 6 to 11 years and females aged 15 years are the age groups that are most secure financially, with 100.0% of males and 100.0% of females in these age groups living above the poverty line.
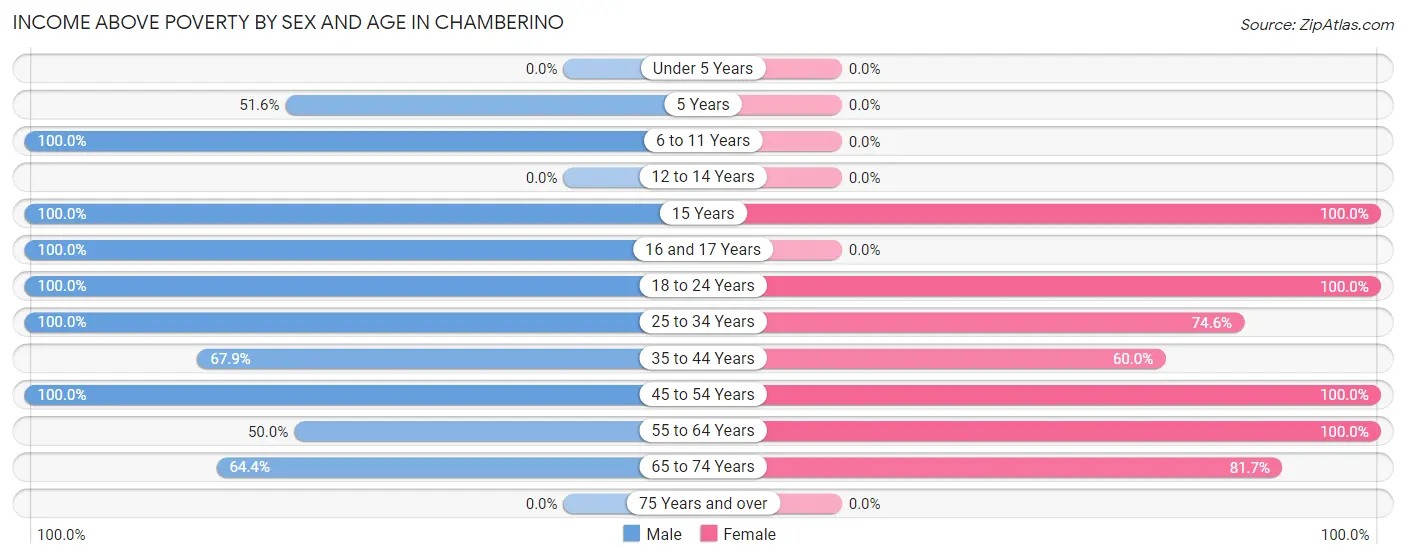
| Age Bracket | Male | Female |
| Under 5 Years | 0 (0.0%) | 0 (0.0%) |
| 5 Years | 16 (51.6%) | 0 (0.0%) |
| 6 to 11 Years | 29 (100.0%) | 0 (0.0%) |
| 12 to 14 Years | 0 (0.0%) | 0 (0.0%) |
| 15 Years | 10 (100.0%) | 15 (100.0%) |
| 16 and 17 Years | 14 (100.0%) | 0 (0.0%) |
| 18 to 24 Years | 56 (100.0%) | 16 (100.0%) |
| 25 to 34 Years | 49 (100.0%) | 50 (74.6%) |
| 35 to 44 Years | 36 (67.9%) | 21 (60.0%) |
| 45 to 54 Years | 12 (100.0%) | 47 (100.0%) |
| 55 to 64 Years | 24 (50.0%) | 10 (100.0%) |
| 65 to 74 Years | 47 (64.4%) | 49 (81.7%) |
| 75 Years and over | 0 (0.0%) | 0 (0.0%) |
| Total | 293 (77.9%) | 208 (60.5%) |
Income Below Poverty Among Married-Couple Families in Chamberino
The poverty statistics for married-couple families in Chamberino show that 18.9% or 30 of the total 159 families live below the poverty line. Families with 5 or more children have the highest poverty rate of 100.0%, comprising of 17 families. On the other hand, families with 1 or 2 children have the lowest poverty rate of 0.0%, which includes 0 families.
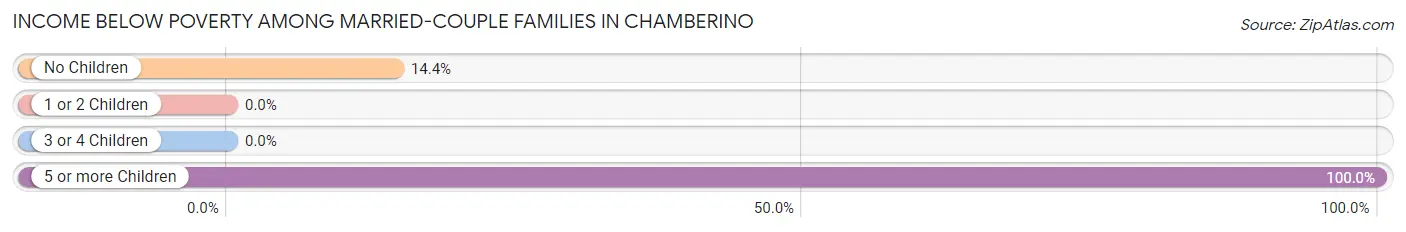
| Children | Above Poverty | Below Poverty |
| No Children | 77 (85.6%) | 13 (14.4%) |
| 1 or 2 Children | 52 (100.0%) | 0 (0.0%) |
| 3 or 4 Children | 0 (0.0%) | 0 (0.0%) |
| 5 or more Children | 0 (0.0%) | 17 (100.0%) |
| Total | 129 (81.1%) | 30 (18.9%) |
Income Below Poverty Among Single-Parent Households in Chamberino
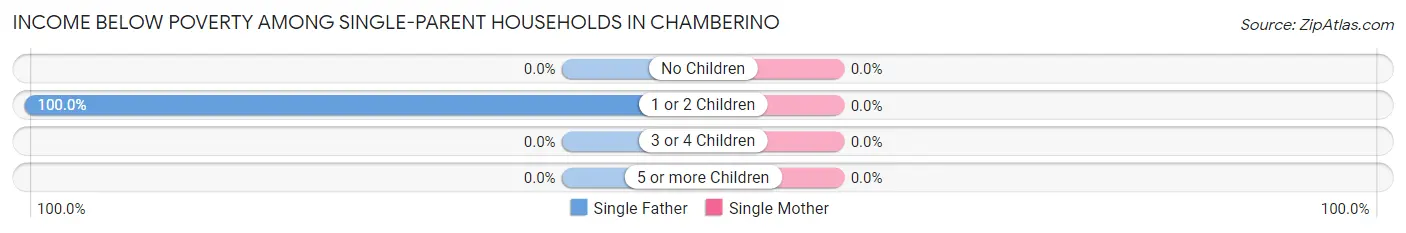
| Children | Single Father | Single Mother |
| No Children | 0 (0.0%) | 0 (0.0%) |
| 1 or 2 Children | 11 (100.0%) | 0 (0.0%) |
| 3 or 4 Children | 0 (0.0%) | 0 (0.0%) |
| 5 or more Children | 0 (0.0%) | 0 (0.0%) |
| Total | 11 (100.0%) | 0 (0.0%) |
Income Below Poverty Among Married-Couple vs Single-Parent Households in Chamberino
The poverty data for Chamberino shows that 30 of the married-couple family households (18.9%) and 11 of the single-parent households (100.0%) are living below the poverty level. Within the married-couple family households, those with 5 or more children have the highest poverty rate, with 17 households (100.0%) falling below the poverty line. Among the single-parent households, those with 1 or 2 children have the highest poverty rate, with 11 household (100.0%) living below poverty.
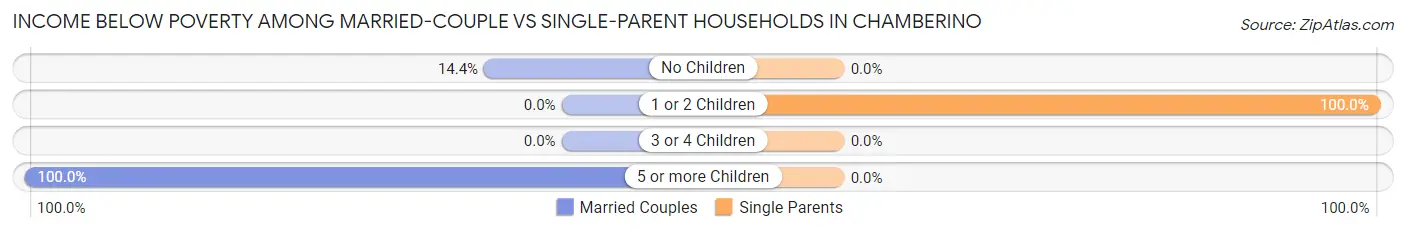
| Children | Married-Couple Families | Single-Parent Households |
| No Children | 13 (14.4%) | 0 (0.0%) |
| 1 or 2 Children | 0 (0.0%) | 11 (100.0%) |
| 3 or 4 Children | 0 (0.0%) | 0 (0.0%) |
| 5 or more Children | 17 (100.0%) | 0 (0.0%) |
| Total | 30 (18.9%) | 11 (100.0%) |
Employment Characteristics in Chamberino
Employment by Class of Employer in Chamberino
Among the 302 employed individuals in Chamberino, private company employees (124 | 41.1%), local government employees (83 | 27.5%), and self-employed (incorporated) (38 | 12.6%) make up the most common classes of employment.
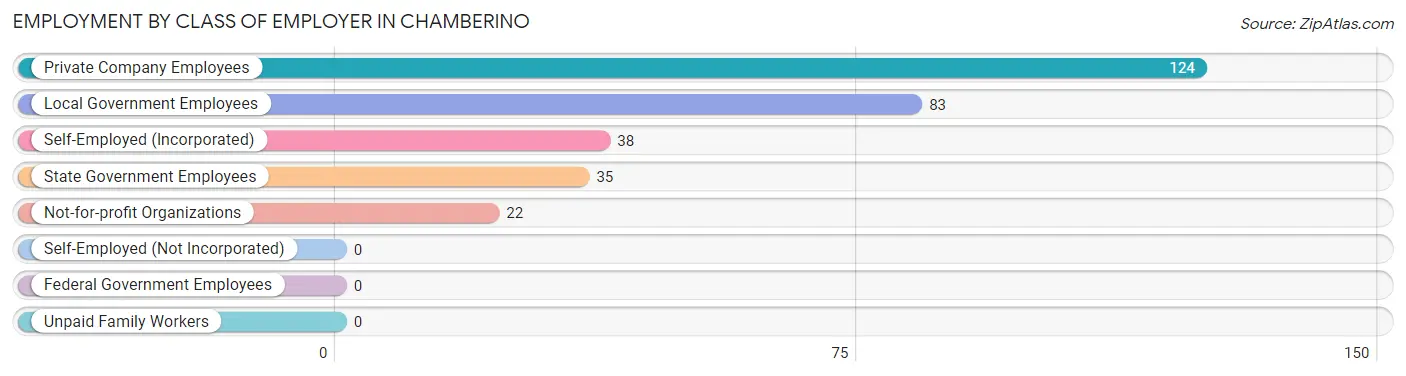
| Employer Class | # Employees | % Employees |
| Private Company Employees | 124 | 41.1% |
| Self-Employed (Incorporated) | 38 | 12.6% |
| Self-Employed (Not Incorporated) | 0 | 0.0% |
| Not-for-profit Organizations | 22 | 7.3% |
| Local Government Employees | 83 | 27.5% |
| State Government Employees | 35 | 11.6% |
| Federal Government Employees | 0 | 0.0% |
| Unpaid Family Workers | 0 | 0.0% |
| Total | 302 | 100.0% |
Employment Status by Age in Chamberino
According to the labor force statistics for Chamberino, out of the total population over 16 years of age (555), 57.1% or 317 individuals are in the labor force, with 4.7% or 15 of them unemployed. The age group with the highest labor force participation rate is 20 to 24 years, with 100.0% or 38 individuals in the labor force. Within the labor force, the 45 to 54 years age range has the highest percentage of unemployed individuals, with 25.4% or 15 of them being unemployed.
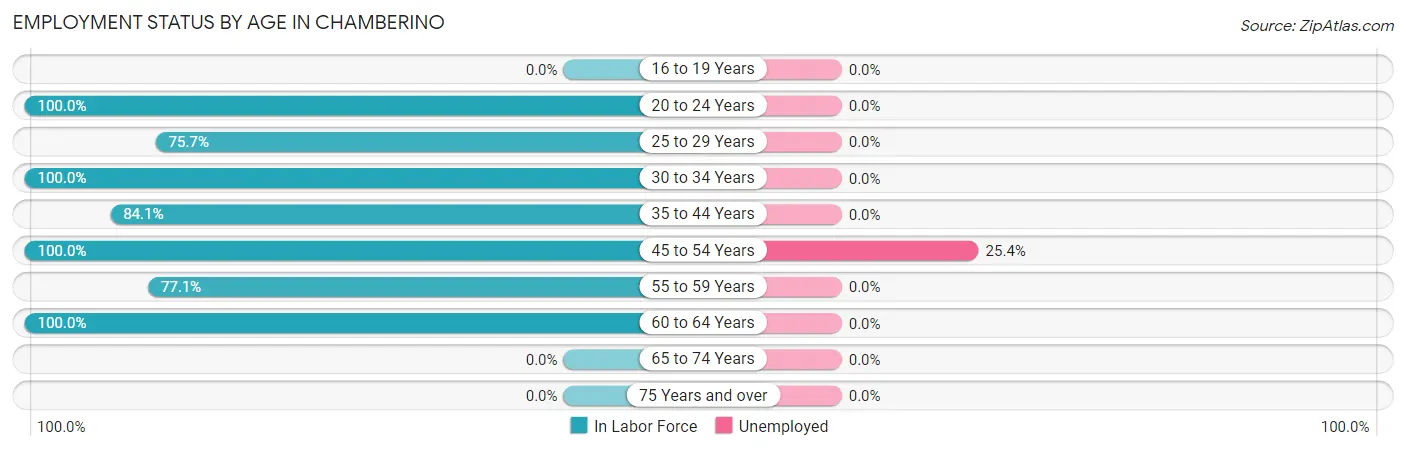
| Age Bracket | In Labor Force | Unemployed |
| 16 to 19 Years | 0 (0.0%) | 0 (0.0%) |
| 20 to 24 Years | 38 (100.0%) | 0 (0.0%) |
| 25 to 29 Years | 53 (75.7%) | 0 (0.0%) |
| 30 to 34 Years | 46 (100.0%) | 0 (0.0%) |
| 35 to 44 Years | 74 (84.1%) | 0 (0.0%) |
| 45 to 54 Years | 59 (100.0%) | 15 (25.4%) |
| 55 to 59 Years | 37 (77.1%) | 0 (0.0%) |
| 60 to 64 Years | 10 (100.0%) | 0 (0.0%) |
| 65 to 74 Years | 0 (0.0%) | 0 (0.0%) |
| 75 Years and over | 0 (0.0%) | 0 (0.0%) |
| Total | 317 (57.1%) | 15 (4.7%) |
Employment Status by Educational Attainment in Chamberino
According to labor force statistics for Chamberino, 86.9% of individuals (279) out of the total population between 25 and 64 years of age (321) are in the labor force, with 5.4% or 15 of them being unemployed. The group with the highest labor force participation rate are those with the educational attainment of bachelor's degree or higher, with 100.0% or 143 individuals in the labor force. Within the labor force, individuals with less than high school education have the highest percentage of unemployment, with 25.4% or 15 of them being unemployed.
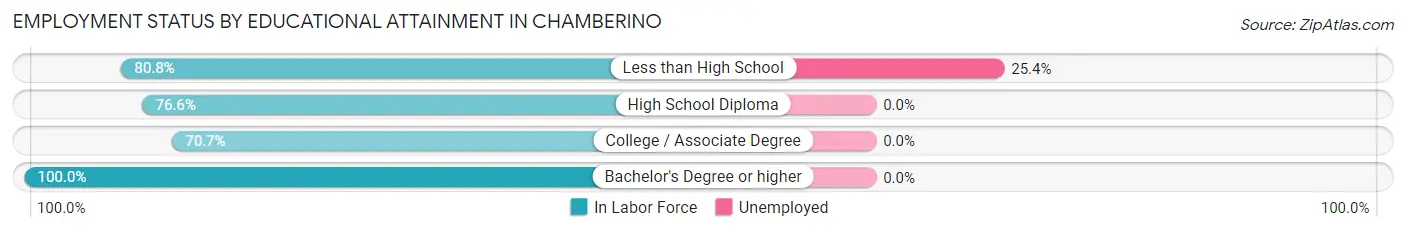
| Educational Attainment | In Labor Force | Unemployed |
| Less than High School | 59 (80.8%) | 19 (25.4%) |
| High School Diploma | 36 (76.6%) | 0 (0.0%) |
| College / Associate Degree | 41 (70.7%) | 0 (0.0%) |
| Bachelor's Degree or higher | 143 (100.0%) | 0 (0.0%) |
| Total | 279 (86.9%) | 17 (5.4%) |
Employment Occupations by Sex in Chamberino
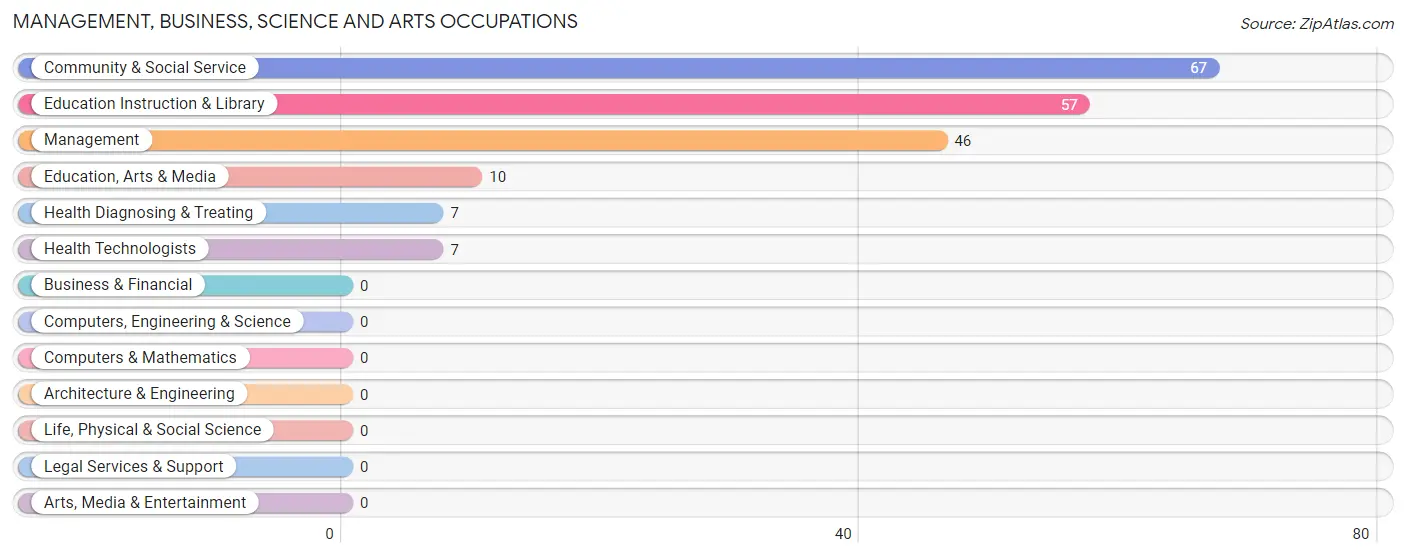
Management, Business, Science and Arts Occupations
The most common Management, Business, Science and Arts occupations in Chamberino are Community & Social Service (67 | 22.2%), Education Instruction & Library (57 | 18.9%), Management (46 | 15.2%), Education, Arts & Media (10 | 3.3%), and Health Diagnosing & Treating (7 | 2.3%).
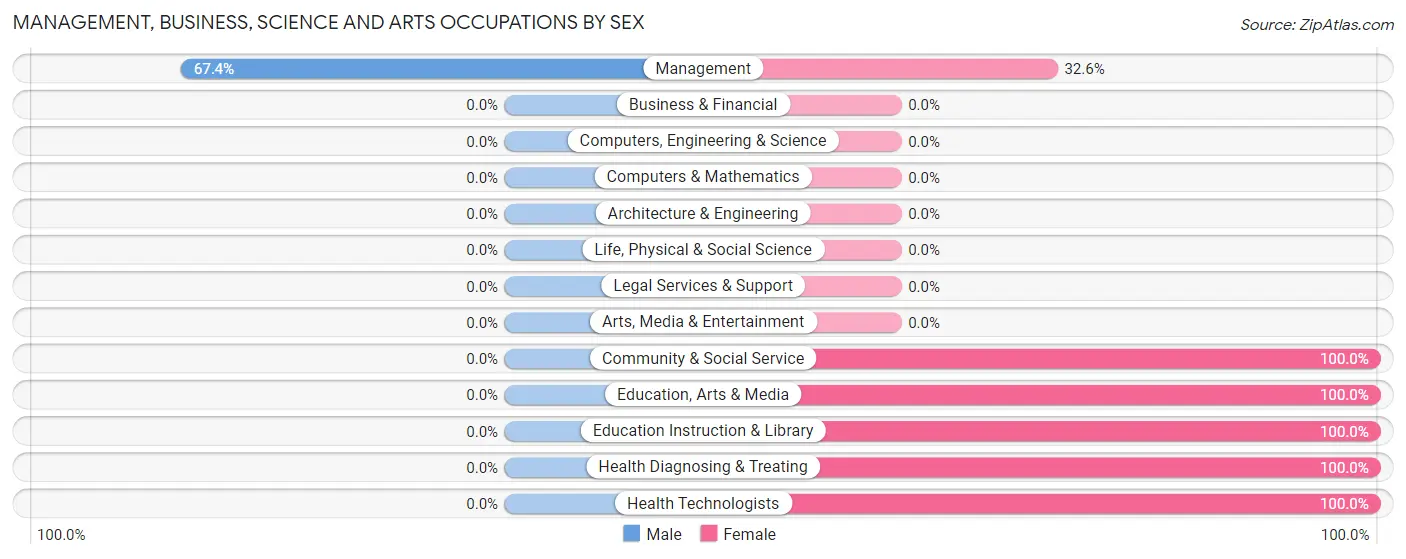
Management, Business, Science and Arts Occupations by Sex
| Occupation | Male | Female |
| Management | 31 (67.4%) | 15 (32.6%) |
| Business & Financial | 0 (0.0%) | 0 (0.0%) |
| Computers, Engineering & Science | 0 (0.0%) | 0 (0.0%) |
| Computers & Mathematics | 0 (0.0%) | 0 (0.0%) |
| Architecture & Engineering | 0 (0.0%) | 0 (0.0%) |
| Life, Physical & Social Science | 0 (0.0%) | 0 (0.0%) |
| Community & Social Service | 0 (0.0%) | 67 (100.0%) |
| Education, Arts & Media | 0 (0.0%) | 10 (100.0%) |
| Legal Services & Support | 0 (0.0%) | 0 (0.0%) |
| Education Instruction & Library | 0 (0.0%) | 57 (100.0%) |
| Arts, Media & Entertainment | 0 (0.0%) | 0 (0.0%) |
| Health Diagnosing & Treating | 0 (0.0%) | 7 (100.0%) |
| Health Technologists | 0 (0.0%) | 7 (100.0%) |
| Total (Category) | 31 (25.8%) | 89 (74.2%) |
| Total (Overall) | 189 (62.6%) | 113 (37.4%) |
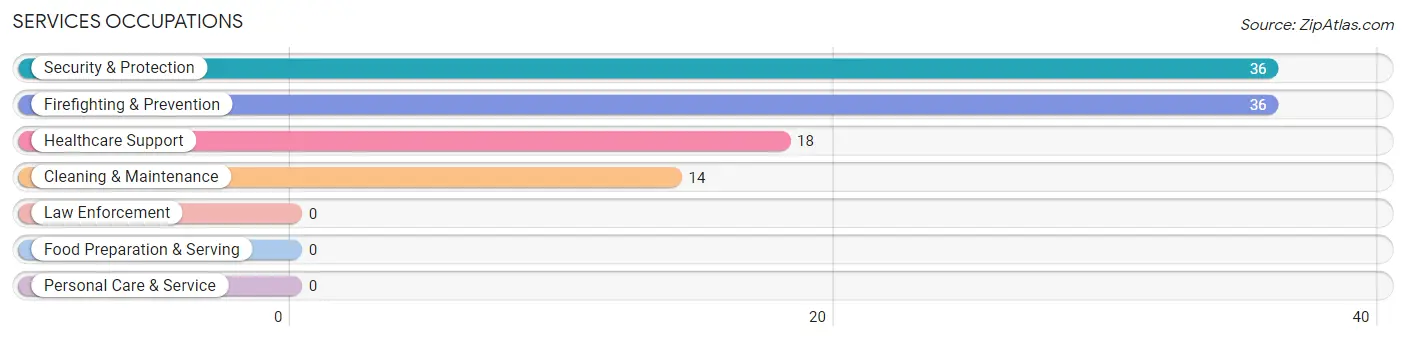
Services Occupations
The most common Services occupations in Chamberino are Security & Protection (36 | 11.9%), Firefighting & Prevention (36 | 11.9%), Healthcare Support (18 | 6.0%), and Cleaning & Maintenance (14 | 4.6%).
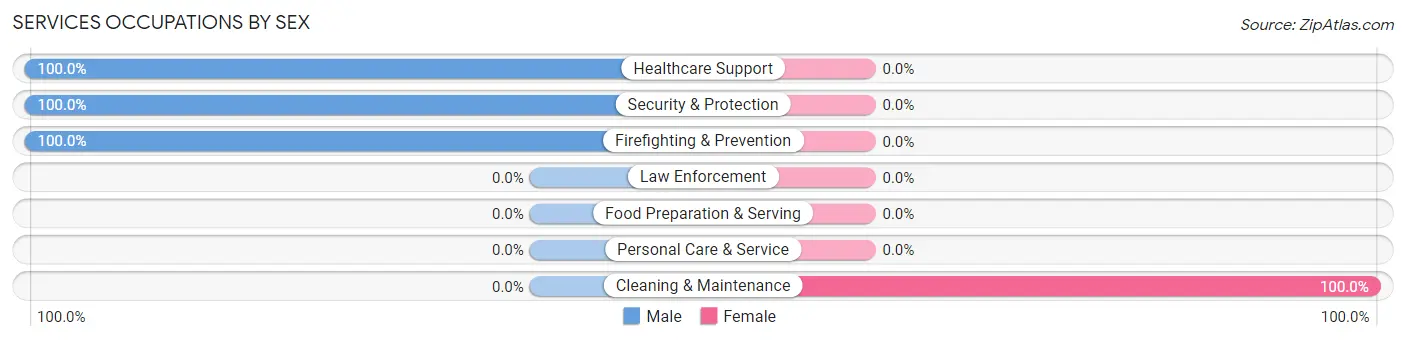
Services Occupations by Sex
| Occupation | Male | Female |
| Healthcare Support | 18 (100.0%) | 0 (0.0%) |
| Security & Protection | 36 (100.0%) | 0 (0.0%) |
| Firefighting & Prevention | 36 (100.0%) | 0 (0.0%) |
| Law Enforcement | 0 (0.0%) | 0 (0.0%) |
| Food Preparation & Serving | 0 (0.0%) | 0 (0.0%) |
| Cleaning & Maintenance | 0 (0.0%) | 14 (100.0%) |
| Personal Care & Service | 0 (0.0%) | 0 (0.0%) |
| Total (Category) | 54 (79.4%) | 14 (20.6%) |
| Total (Overall) | 189 (62.6%) | 113 (37.4%) |
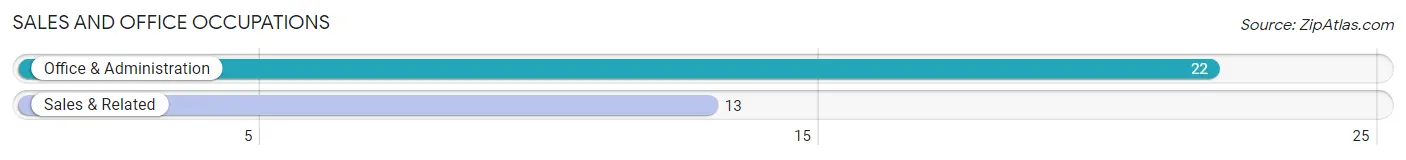
Sales and Office Occupations
The most common Sales and Office occupations in Chamberino are Office & Administration (22 | 7.3%), and Sales & Related (13 | 4.3%).
Sales and Office Occupations by Sex
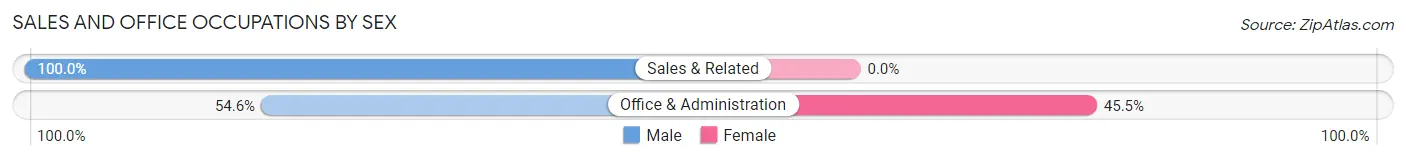
| Occupation | Male | Female |
| Sales & Related | 13 (100.0%) | 0 (0.0%) |
| Office & Administration | 12 (54.5%) | 10 (45.5%) |
| Total (Category) | 25 (71.4%) | 10 (28.6%) |
| Total (Overall) | 189 (62.6%) | 113 (37.4%) |
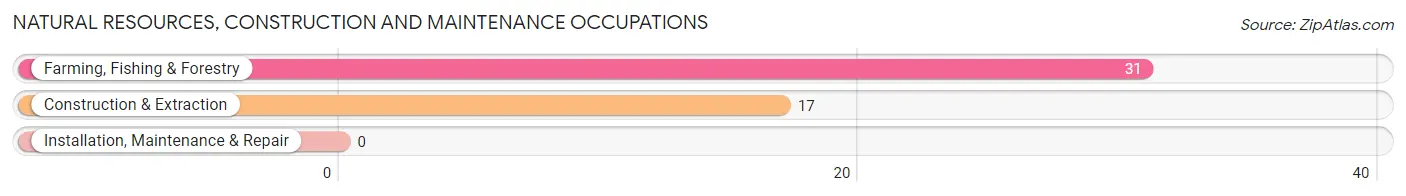
Natural Resources, Construction and Maintenance Occupations
The most common Natural Resources, Construction and Maintenance occupations in Chamberino are Farming, Fishing & Forestry (31 | 10.3%), and Construction & Extraction (17 | 5.6%).
Natural Resources, Construction and Maintenance Occupations by Sex
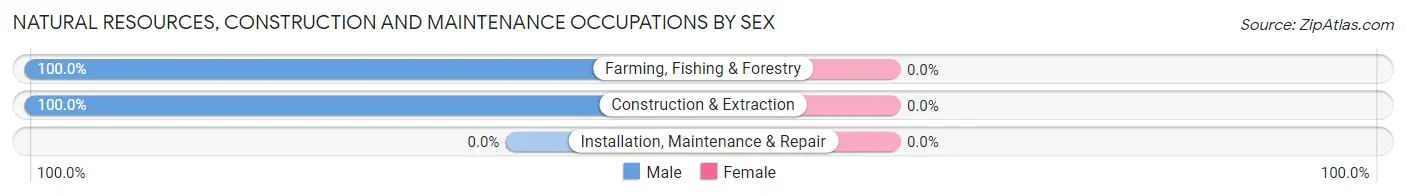
| Occupation | Male | Female |
| Farming, Fishing & Forestry | 31 (100.0%) | 0 (0.0%) |
| Construction & Extraction | 17 (100.0%) | 0 (0.0%) |
| Installation, Maintenance & Repair | 0 (0.0%) | 0 (0.0%) |
| Total (Category) | 48 (100.0%) | 0 (0.0%) |
| Total (Overall) | 189 (62.6%) | 113 (37.4%) |
Production, Transportation and Moving Occupations
The most common Production, Transportation and Moving occupations in Chamberino are Transportation (18 | 6.0%), Material Moving (11 | 3.6%), and Production (2 | 0.7%).
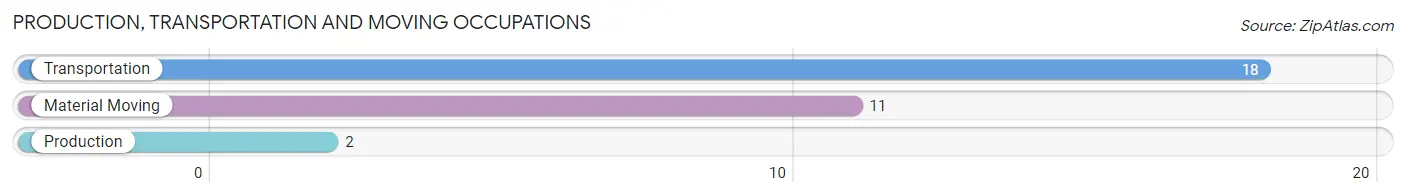
Production, Transportation and Moving Occupations by Sex
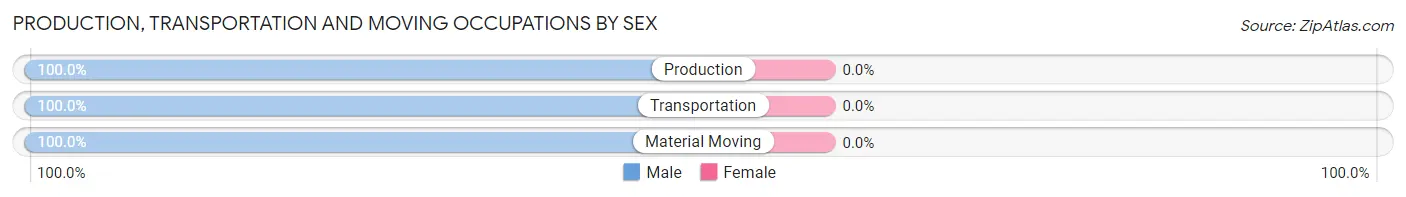
| Occupation | Male | Female |
| Production | 2 (100.0%) | 0 (0.0%) |
| Transportation | 18 (100.0%) | 0 (0.0%) |
| Material Moving | 11 (100.0%) | 0 (0.0%) |
| Total (Category) | 31 (100.0%) | 0 (0.0%) |
| Total (Overall) | 189 (62.6%) | 113 (37.4%) |
Employment Industries by Sex in Chamberino
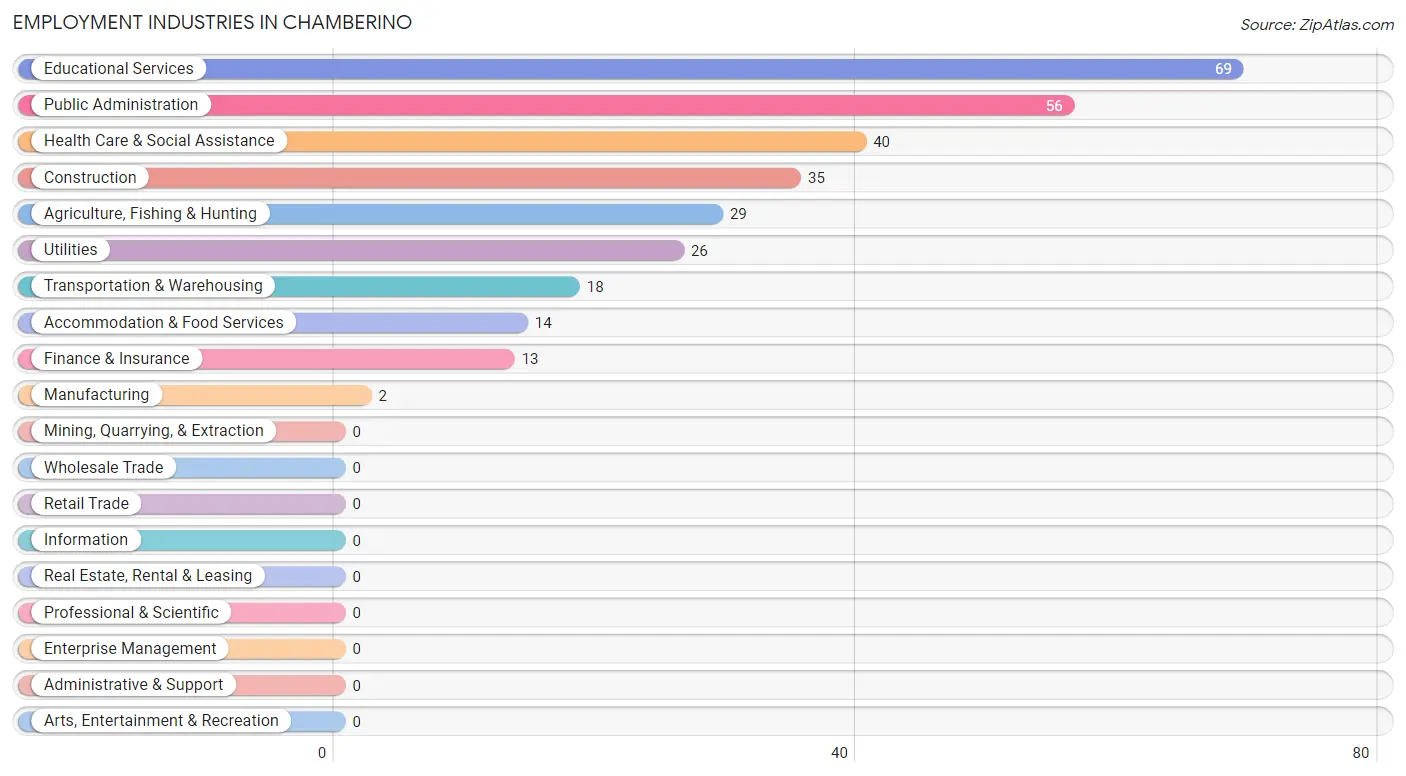
Employment Industries in Chamberino
The major employment industries in Chamberino include Educational Services (69 | 22.9%), Public Administration (56 | 18.5%), Health Care & Social Assistance (40 | 13.3%), Construction (35 | 11.6%), and Agriculture, Fishing & Hunting (29 | 9.6%).
Employment Industries by Sex in Chamberino
The Chamberino industries that see more men than women are Agriculture, Fishing & Hunting (100.0%), Construction (100.0%), and Manufacturing (100.0%), whereas the industries that tend to have a higher number of women are Accommodation & Food Services (100.0%), Educational Services (82.6%), and Health Care & Social Assistance (55.0%).
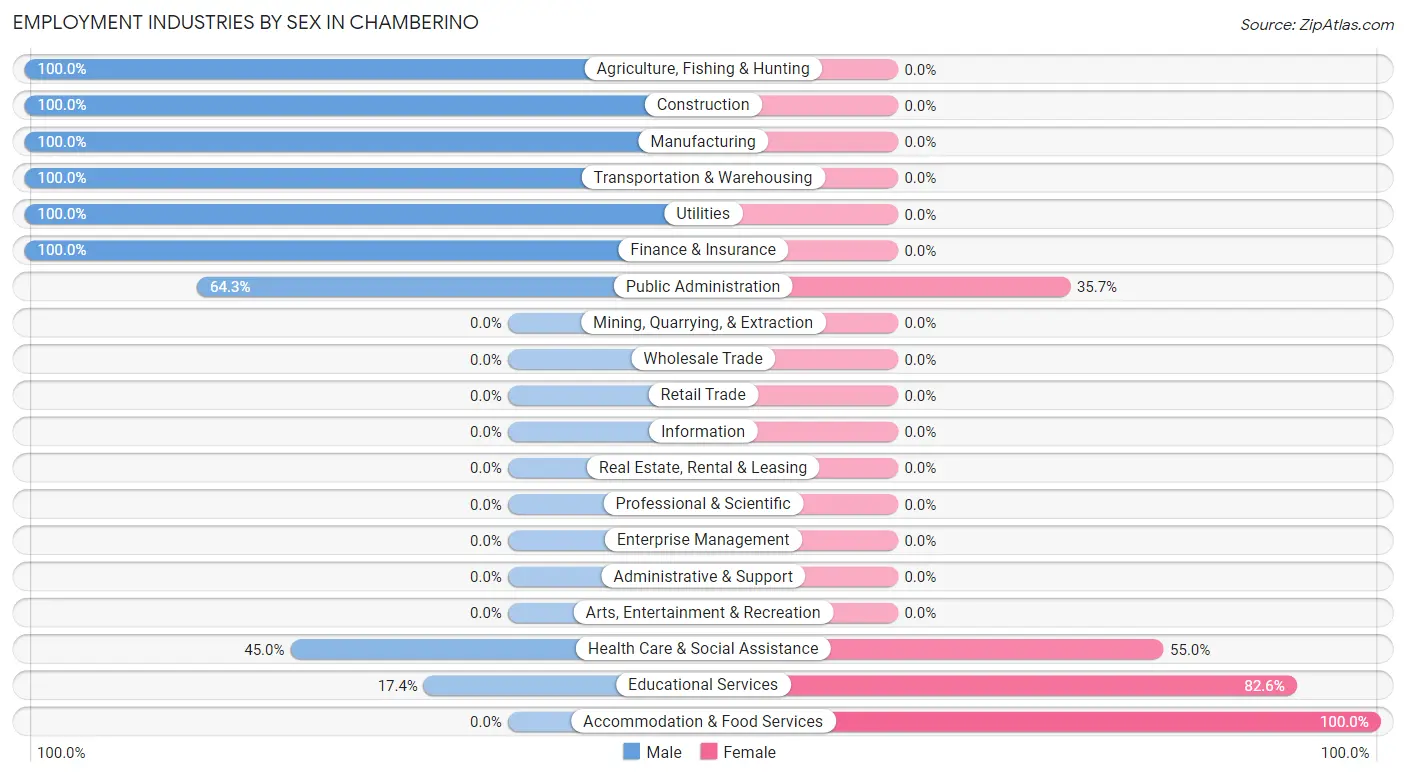
| Industry | Male | Female |
| Agriculture, Fishing & Hunting | 29 (100.0%) | 0 (0.0%) |
| Mining, Quarrying, & Extraction | 0 (0.0%) | 0 (0.0%) |
| Construction | 35 (100.0%) | 0 (0.0%) |
| Manufacturing | 2 (100.0%) | 0 (0.0%) |
| Wholesale Trade | 0 (0.0%) | 0 (0.0%) |
| Retail Trade | 0 (0.0%) | 0 (0.0%) |
| Transportation & Warehousing | 18 (100.0%) | 0 (0.0%) |
| Utilities | 26 (100.0%) | 0 (0.0%) |
| Information | 0 (0.0%) | 0 (0.0%) |
| Finance & Insurance | 13 (100.0%) | 0 (0.0%) |
| Real Estate, Rental & Leasing | 0 (0.0%) | 0 (0.0%) |
| Professional & Scientific | 0 (0.0%) | 0 (0.0%) |
| Enterprise Management | 0 (0.0%) | 0 (0.0%) |
| Administrative & Support | 0 (0.0%) | 0 (0.0%) |
| Educational Services | 12 (17.4%) | 57 (82.6%) |
| Health Care & Social Assistance | 18 (45.0%) | 22 (55.0%) |
| Arts, Entertainment & Recreation | 0 (0.0%) | 0 (0.0%) |
| Accommodation & Food Services | 0 (0.0%) | 14 (100.0%) |
| Public Administration | 36 (64.3%) | 20 (35.7%) |
| Total | 189 (62.6%) | 113 (37.4%) |
Education in Chamberino
School Enrollment in Chamberino
The most common levels of schooling among the 183 students in Chamberino are high school (71 | 38.8%), elementary school (61 | 33.3%), and kindergarten (33 | 18.0%).
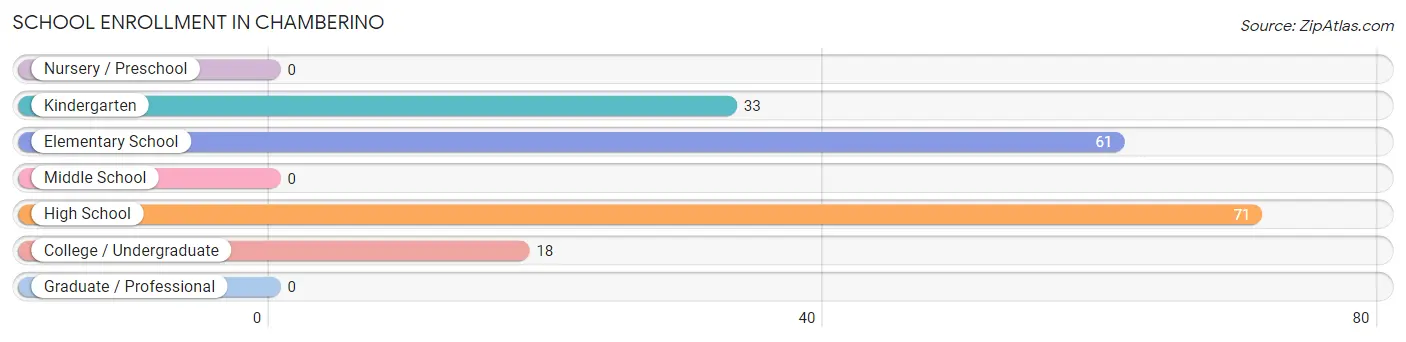
| School Level | # Students | % Students |
| Nursery / Preschool | 0 | 0.0% |
| Kindergarten | 33 | 18.0% |
| Elementary School | 61 | 33.3% |
| Middle School | 0 | 0.0% |
| High School | 71 | 38.8% |
| College / Undergraduate | 18 | 9.8% |
| Graduate / Professional | 0 | 0.0% |
| Total | 183 | 100.0% |
School Enrollment by Age by Funding Source in Chamberino
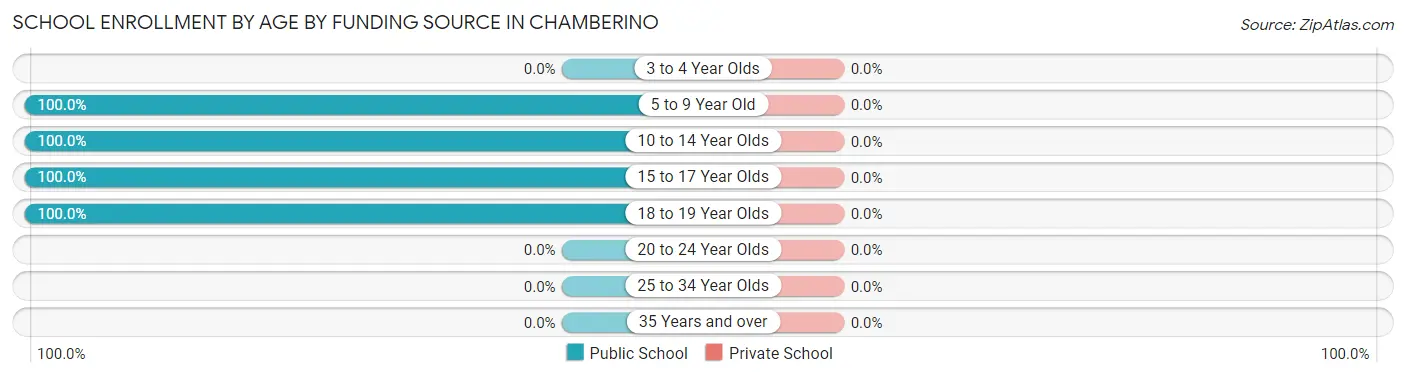
| Age Bracket | Public School | Private School |
| 3 to 4 Year Olds | 0 (0.0%) | 0 (0.0%) |
| 5 to 9 Year Old | 94 (100.0%) | 0 (0.0%) |
| 10 to 14 Year Olds | 16 (100.0%) | 0 (0.0%) |
| 15 to 17 Year Olds | 39 (100.0%) | 0 (0.0%) |
| 18 to 19 Year Olds | 34 (100.0%) | 0 (0.0%) |
| 20 to 24 Year Olds | 0 (0.0%) | 0 (0.0%) |
| 25 to 34 Year Olds | 0 (0.0%) | 0 (0.0%) |
| 35 Years and over | 0 (0.0%) | 0 (0.0%) |
| Total | 183 (100.0%) | 0 (0.0%) |
Educational Attainment by Field of Study in Chamberino
Education (62 | 43.4%), arts & humanities (20 | 14.0%), bio, nature & agricultural (18 | 12.6%), engineering (18 | 12.6%), and business (13 | 9.1%) are the most common fields of study among 143 individuals in Chamberino who have obtained a bachelor's degree or higher.
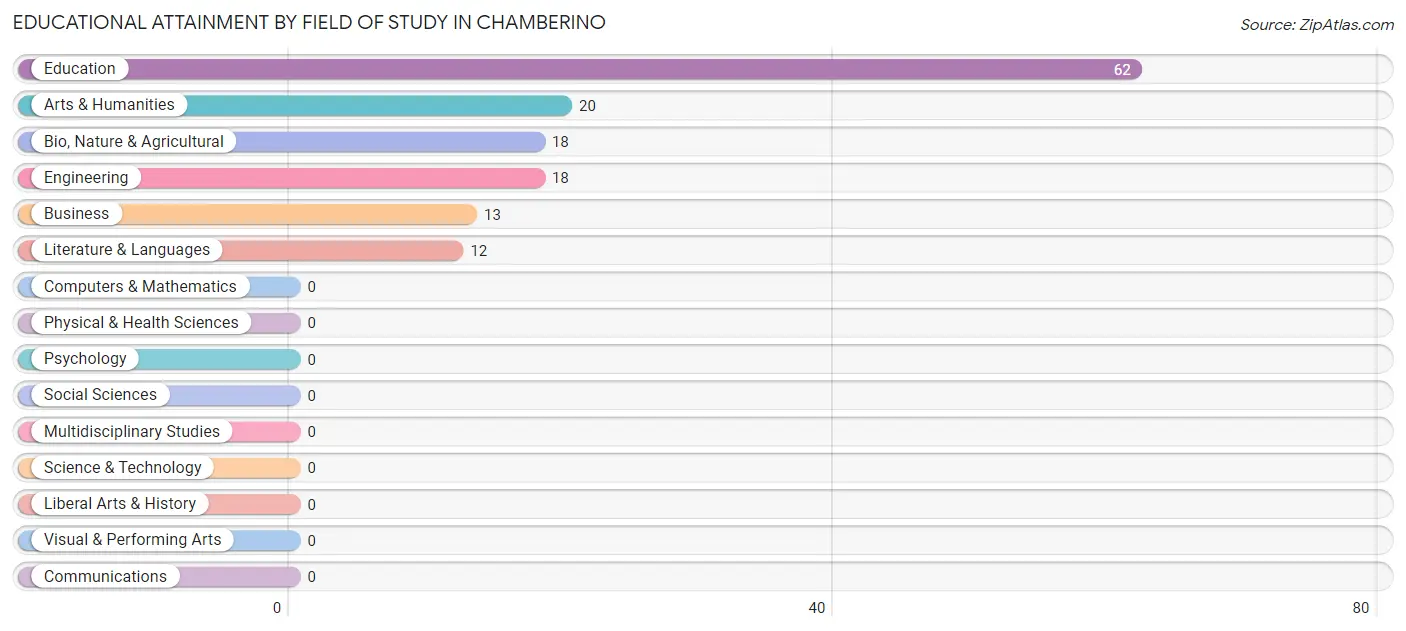
| Field of Study | # Graduates | % Graduates |
| Computers & Mathematics | 0 | 0.0% |
| Bio, Nature & Agricultural | 18 | 12.6% |
| Physical & Health Sciences | 0 | 0.0% |
| Psychology | 0 | 0.0% |
| Social Sciences | 0 | 0.0% |
| Engineering | 18 | 12.6% |
| Multidisciplinary Studies | 0 | 0.0% |
| Science & Technology | 0 | 0.0% |
| Business | 13 | 9.1% |
| Education | 62 | 43.4% |
| Literature & Languages | 12 | 8.4% |
| Liberal Arts & History | 0 | 0.0% |
| Visual & Performing Arts | 0 | 0.0% |
| Communications | 0 | 0.0% |
| Arts & Humanities | 20 | 14.0% |
| Total | 143 | 100.0% |
Transportation & Commute in Chamberino
Vehicle Availability by Sex in Chamberino
The most prevalent vehicle ownership categories in Chamberino are males with 3 vehicles (63, accounting for 33.3%) and females with 3 vehicles (40, making up 55.7%).
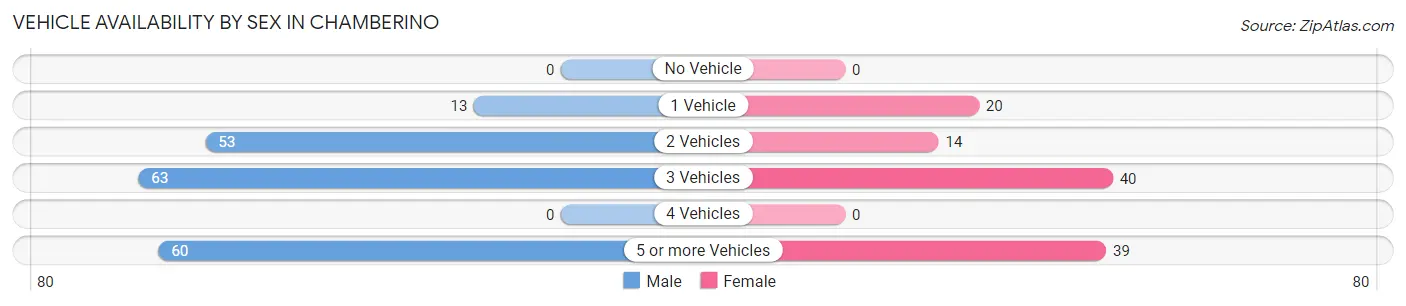
| Vehicles Available | Male | Female |
| No Vehicle | 0 (0.0%) | 0 (0.0%) |
| 1 Vehicle | 13 (6.9%) | 20 (17.7%) |
| 2 Vehicles | 53 (28.0%) | 14 (12.4%) |
| 3 Vehicles | 63 (33.3%) | 40 (35.4%) |
| 4 Vehicles | 0 (0.0%) | 0 (0.0%) |
| 5 or more Vehicles | 60 (31.8%) | 39 (34.5%) |
| Total | 189 (100.0%) | 113 (100.0%) |
Commute Time in Chamberino
The most frequently occuring commute durations in Chamberino are 30 to 34 minutes (95 commuters, 37.1%), 40 to 44 minutes (51 commuters, 19.9%), and 15 to 19 minutes (30 commuters, 11.7%).
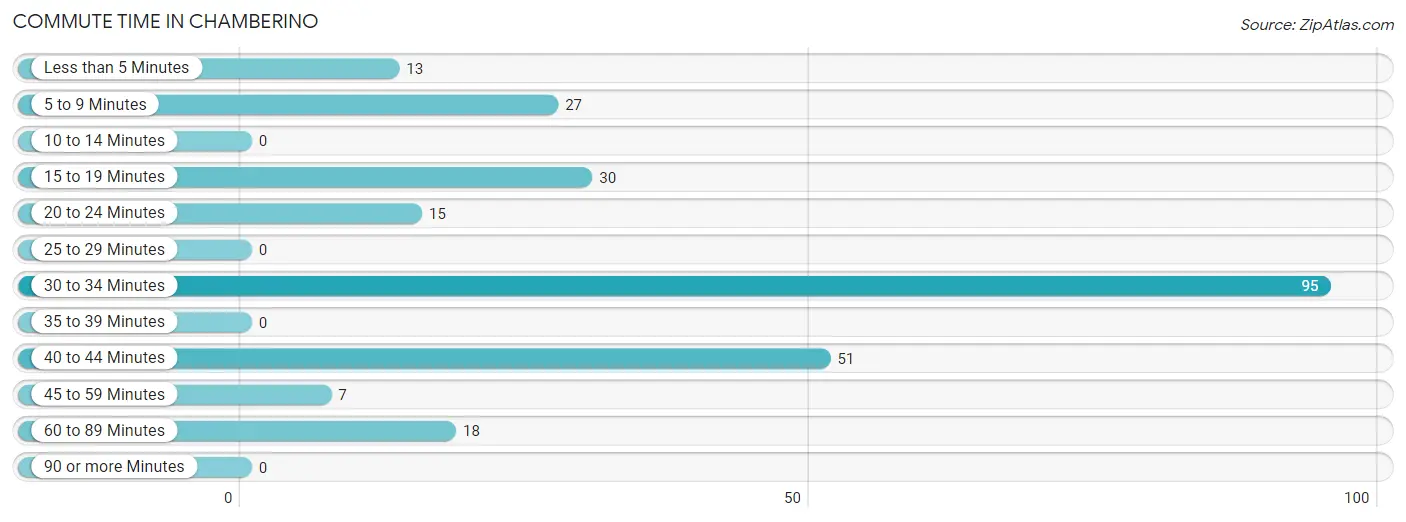
| Commute Time | # Commuters | % Commuters |
| Less than 5 Minutes | 13 | 5.1% |
| 5 to 9 Minutes | 27 | 10.5% |
| 10 to 14 Minutes | 0 | 0.0% |
| 15 to 19 Minutes | 30 | 11.7% |
| 20 to 24 Minutes | 15 | 5.9% |
| 25 to 29 Minutes | 0 | 0.0% |
| 30 to 34 Minutes | 95 | 37.1% |
| 35 to 39 Minutes | 0 | 0.0% |
| 40 to 44 Minutes | 51 | 19.9% |
| 45 to 59 Minutes | 7 | 2.7% |
| 60 to 89 Minutes | 18 | 7.0% |
| 90 or more Minutes | 0 | 0.0% |
Commute Time by Sex in Chamberino
The most common commute times in Chamberino are 30 to 34 minutes (70 commuters, 45.8%) for males and 15 to 19 minutes (30 commuters, 29.1%) for females.
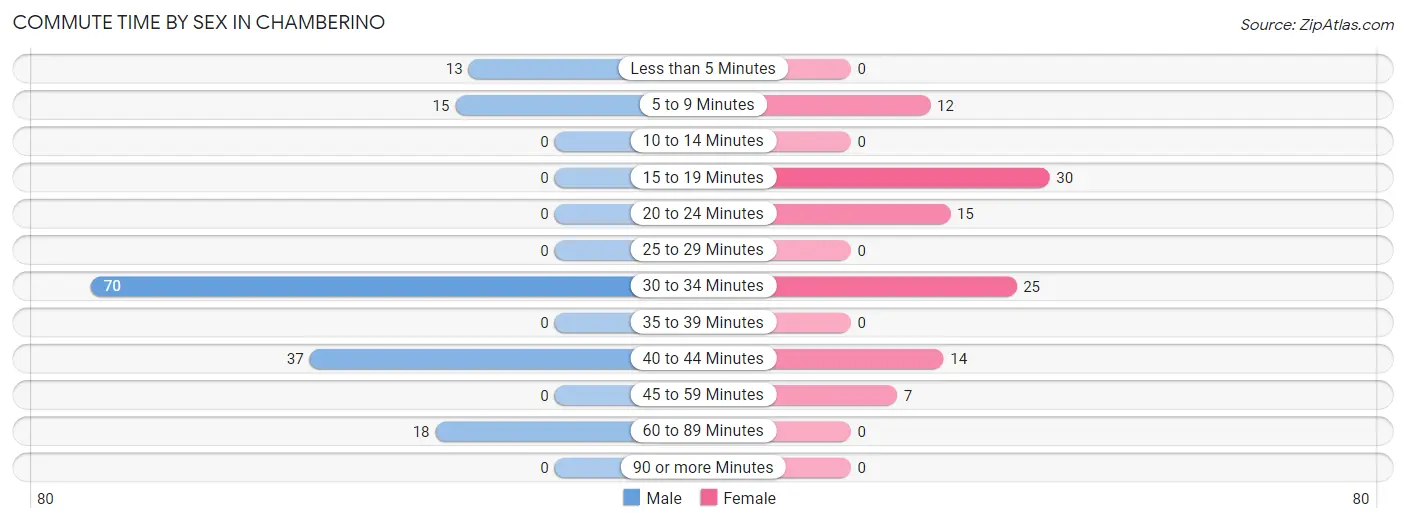
| Commute Time | Male | Female |
| Less than 5 Minutes | 13 (8.5%) | 0 (0.0%) |
| 5 to 9 Minutes | 15 (9.8%) | 12 (11.7%) |
| 10 to 14 Minutes | 0 (0.0%) | 0 (0.0%) |
| 15 to 19 Minutes | 0 (0.0%) | 30 (29.1%) |
| 20 to 24 Minutes | 0 (0.0%) | 15 (14.6%) |
| 25 to 29 Minutes | 0 (0.0%) | 0 (0.0%) |
| 30 to 34 Minutes | 70 (45.8%) | 25 (24.3%) |
| 35 to 39 Minutes | 0 (0.0%) | 0 (0.0%) |
| 40 to 44 Minutes | 37 (24.2%) | 14 (13.6%) |
| 45 to 59 Minutes | 0 (0.0%) | 7 (6.8%) |
| 60 to 89 Minutes | 18 (11.8%) | 0 (0.0%) |
| 90 or more Minutes | 0 (0.0%) | 0 (0.0%) |
Time of Departure to Work by Sex in Chamberino
The most frequent times of departure to work in Chamberino are 7:00 AM to 7:29 AM (84, 54.9%) for males and 7:00 AM to 7:29 AM (57, 55.3%) for females.
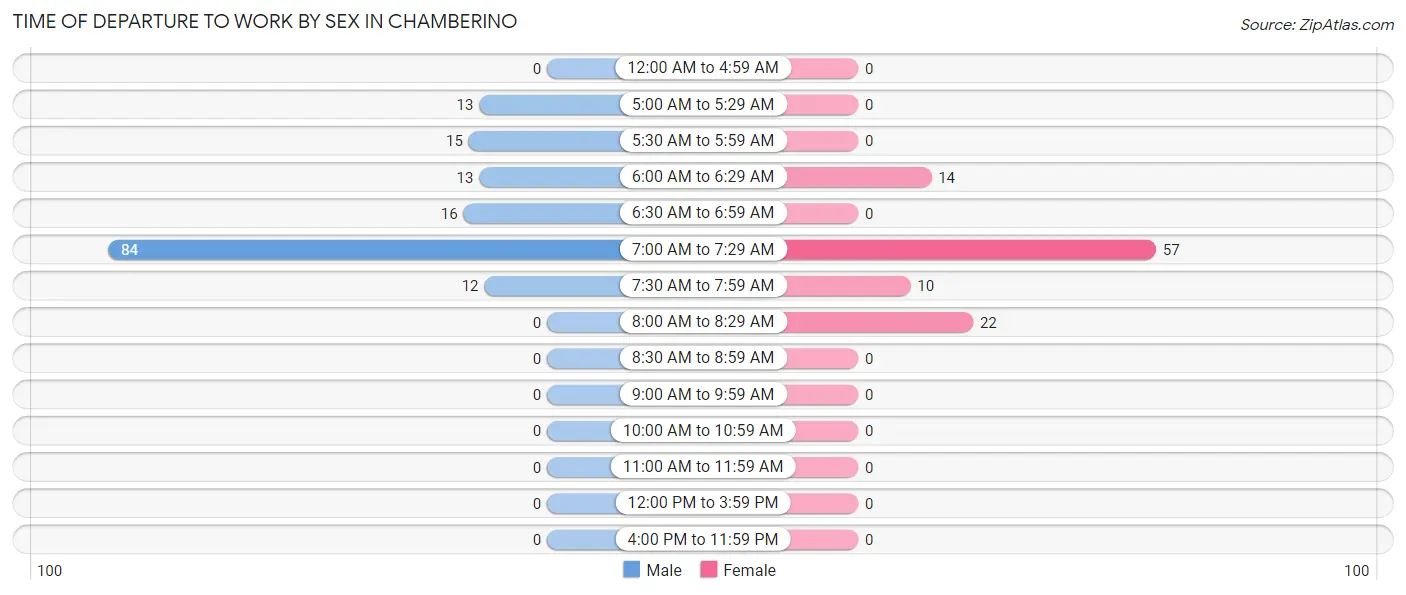
| Time of Departure | Male | Female |
| 12:00 AM to 4:59 AM | 0 (0.0%) | 0 (0.0%) |
| 5:00 AM to 5:29 AM | 13 (8.5%) | 0 (0.0%) |
| 5:30 AM to 5:59 AM | 15 (9.8%) | 0 (0.0%) |
| 6:00 AM to 6:29 AM | 13 (8.5%) | 14 (13.6%) |
| 6:30 AM to 6:59 AM | 16 (10.5%) | 0 (0.0%) |
| 7:00 AM to 7:29 AM | 84 (54.9%) | 57 (55.3%) |
| 7:30 AM to 7:59 AM | 12 (7.8%) | 10 (9.7%) |
| 8:00 AM to 8:29 AM | 0 (0.0%) | 22 (21.4%) |
| 8:30 AM to 8:59 AM | 0 (0.0%) | 0 (0.0%) |
| 9:00 AM to 9:59 AM | 0 (0.0%) | 0 (0.0%) |
| 10:00 AM to 10:59 AM | 0 (0.0%) | 0 (0.0%) |
| 11:00 AM to 11:59 AM | 0 (0.0%) | 0 (0.0%) |
| 12:00 PM to 3:59 PM | 0 (0.0%) | 0 (0.0%) |
| 4:00 PM to 11:59 PM | 0 (0.0%) | 0 (0.0%) |
| Total | 153 (100.0%) | 103 (100.0%) |
Housing Occupancy in Chamberino
Occupancy by Ownership in Chamberino
Of the total 243 dwellings in Chamberino, owner-occupied units account for 177 (72.8%), while renter-occupied units make up 66 (27.2%).
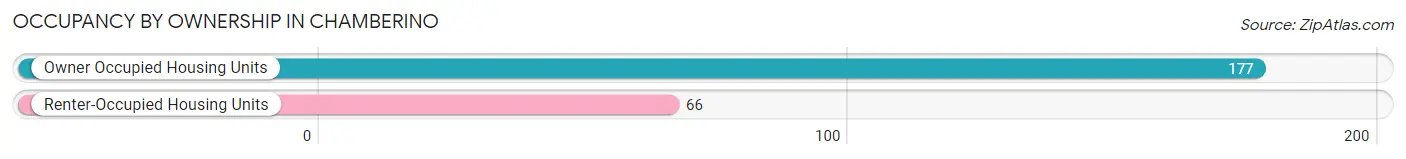
| Occupancy | # Housing Units | % Housing Units |
| Owner Occupied Housing Units | 177 | 72.8% |
| Renter-Occupied Housing Units | 66 | 27.2% |
| Total Occupied Housing Units | 243 | 100.0% |
Occupancy by Household Size in Chamberino
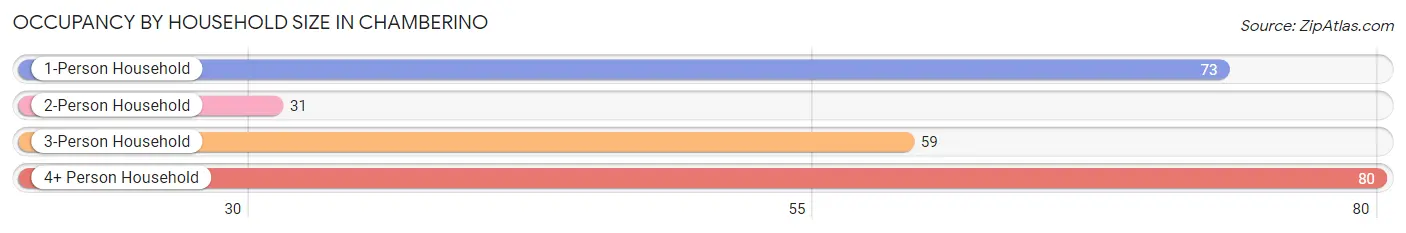
| Household Size | # Housing Units | % Housing Units |
| 1-Person Household | 73 | 30.0% |
| 2-Person Household | 31 | 12.8% |
| 3-Person Household | 59 | 24.3% |
| 4+ Person Household | 80 | 32.9% |
| Total Housing Units | 243 | 100.0% |
Occupancy by Ownership by Household Size in Chamberino
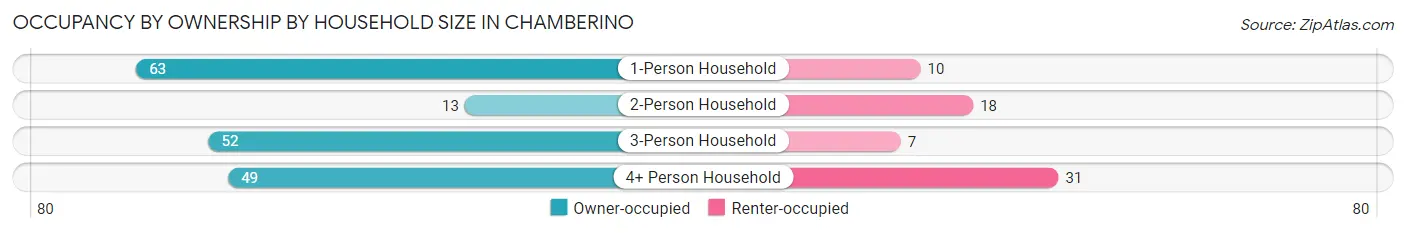
| Household Size | Owner-occupied | Renter-occupied |
| 1-Person Household | 63 (86.3%) | 10 (13.7%) |
| 2-Person Household | 13 (41.9%) | 18 (58.1%) |
| 3-Person Household | 52 (88.1%) | 7 (11.9%) |
| 4+ Person Household | 49 (61.3%) | 31 (38.8%) |
| Total Housing Units | 177 (72.8%) | 66 (27.2%) |
Occupancy by Educational Attainment in Chamberino
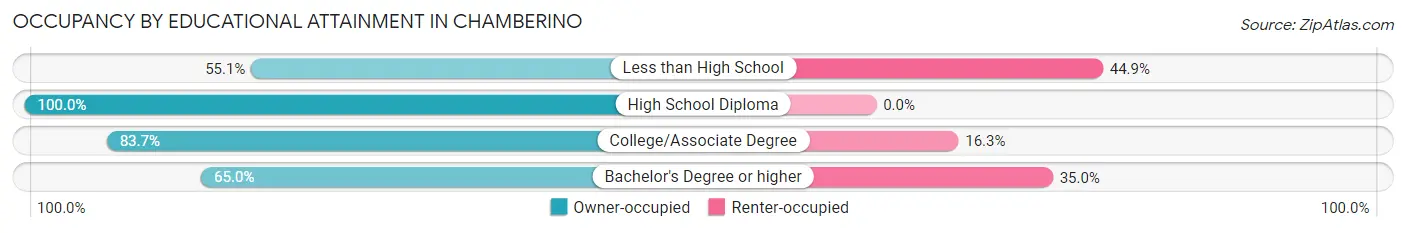
| Household Size | Owner-occupied | Renter-occupied |
| Less than High School | 38 (55.1%) | 31 (44.9%) |
| High School Diploma | 51 (100.0%) | 0 (0.0%) |
| College/Associate Degree | 36 (83.7%) | 7 (16.3%) |
| Bachelor's Degree or higher | 52 (65.0%) | 28 (35.0%) |
Occupancy by Age of Householder in Chamberino
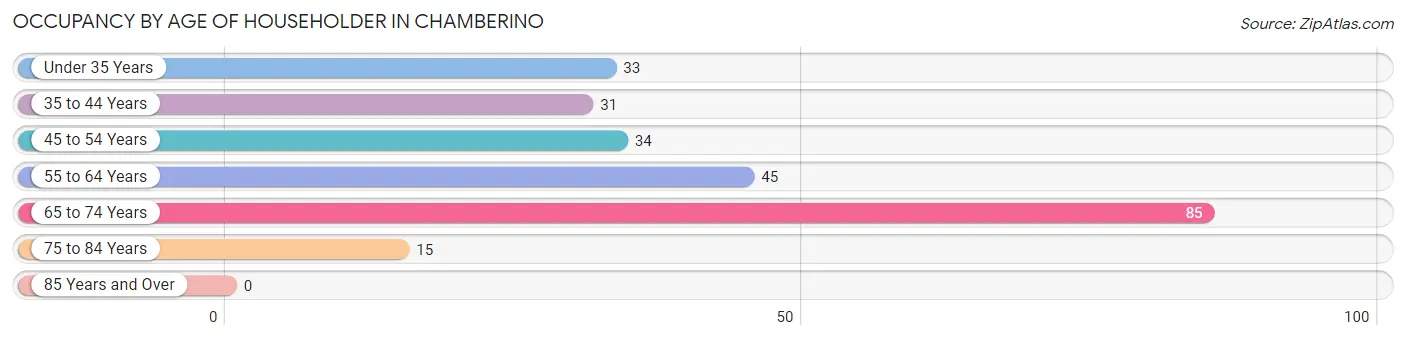
| Age Bracket | # Households | % Households |
| Under 35 Years | 33 | 13.6% |
| 35 to 44 Years | 31 | 12.8% |
| 45 to 54 Years | 34 | 14.0% |
| 55 to 64 Years | 45 | 18.5% |
| 65 to 74 Years | 85 | 35.0% |
| 75 to 84 Years | 15 | 6.2% |
| 85 Years and Over | 0 | 0.0% |
| Total | 243 | 100.0% |
Housing Finances in Chamberino
Median Income by Occupancy in Chamberino
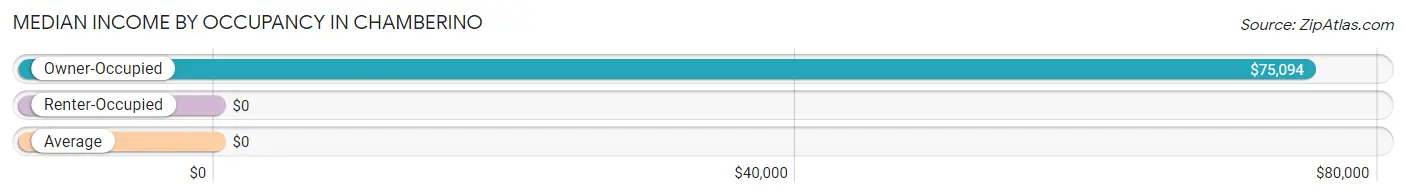
| Occupancy Type | # Households | Median Income |
| Owner-Occupied | 177 (72.8%) | $75,094 |
| Renter-Occupied | 66 (27.2%) | $0 |
| Average | 243 (100.0%) | $0 |
Occupancy by Householder Income Bracket in Chamberino
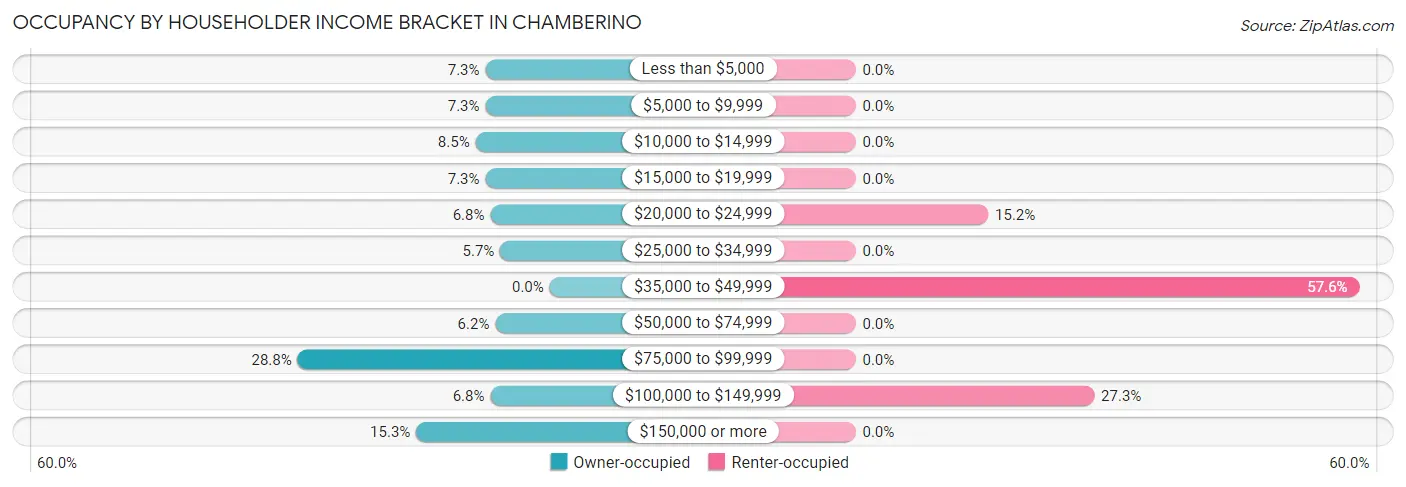
| Income Bracket | Owner-occupied | Renter-occupied |
| Less than $5,000 | 13 (7.3%) | 0 (0.0%) |
| $5,000 to $9,999 | 13 (7.3%) | 0 (0.0%) |
| $10,000 to $14,999 | 15 (8.5%) | 0 (0.0%) |
| $15,000 to $19,999 | 13 (7.3%) | 0 (0.0%) |
| $20,000 to $24,999 | 12 (6.8%) | 10 (15.1%) |
| $25,000 to $34,999 | 10 (5.7%) | 0 (0.0%) |
| $35,000 to $49,999 | 0 (0.0%) | 38 (57.6%) |
| $50,000 to $74,999 | 11 (6.2%) | 0 (0.0%) |
| $75,000 to $99,999 | 51 (28.8%) | 0 (0.0%) |
| $100,000 to $149,999 | 12 (6.8%) | 18 (27.3%) |
| $150,000 or more | 27 (15.2%) | 0 (0.0%) |
| Total | 177 (100.0%) | 66 (100.0%) |
Monthly Housing Cost Tiers in Chamberino
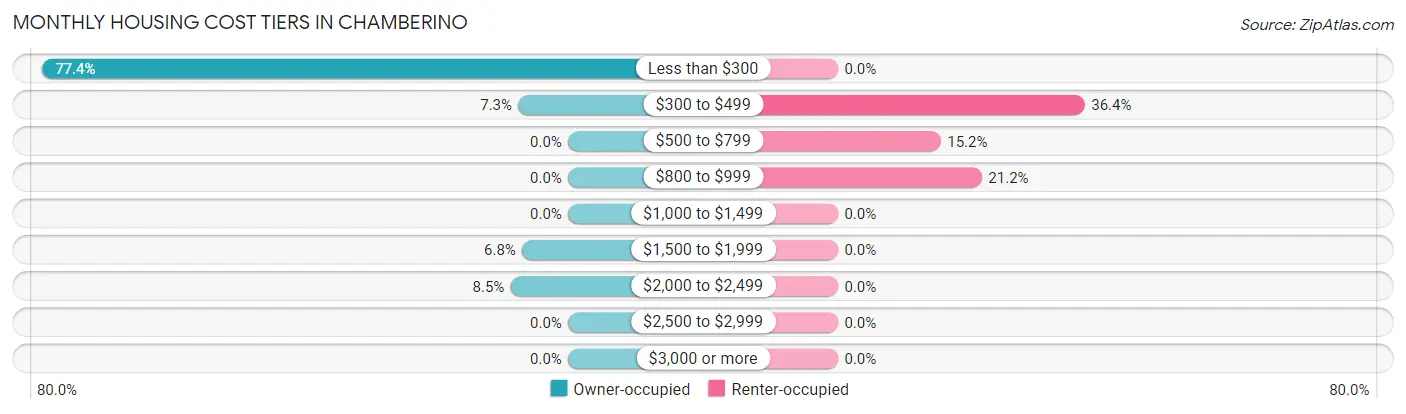
| Monthly Cost | Owner-occupied | Renter-occupied |
| Less than $300 | 137 (77.4%) | 0 (0.0%) |
| $300 to $499 | 13 (7.3%) | 24 (36.4%) |
| $500 to $799 | 0 (0.0%) | 10 (15.1%) |
| $800 to $999 | 0 (0.0%) | 14 (21.2%) |
| $1,000 to $1,499 | 0 (0.0%) | 0 (0.0%) |
| $1,500 to $1,999 | 12 (6.8%) | 0 (0.0%) |
| $2,000 to $2,499 | 15 (8.5%) | 0 (0.0%) |
| $2,500 to $2,999 | 0 (0.0%) | 0 (0.0%) |
| $3,000 or more | 0 (0.0%) | 0 (0.0%) |
| Total | 177 (100.0%) | 66 (100.0%) |
Physical Housing Characteristics in Chamberino
Housing Structures in Chamberino
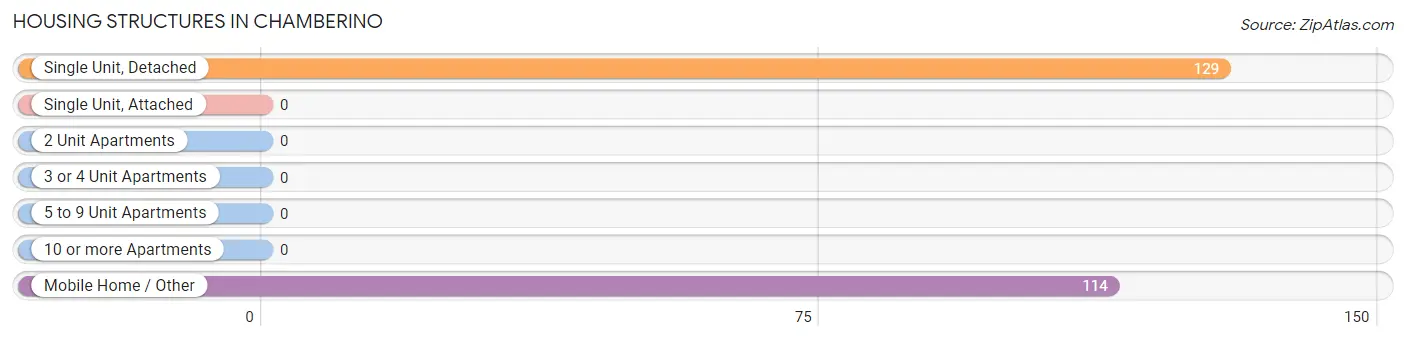
| Structure Type | # Housing Units | % Housing Units |
| Single Unit, Detached | 129 | 53.1% |
| Single Unit, Attached | 0 | 0.0% |
| 2 Unit Apartments | 0 | 0.0% |
| 3 or 4 Unit Apartments | 0 | 0.0% |
| 5 to 9 Unit Apartments | 0 | 0.0% |
| 10 or more Apartments | 0 | 0.0% |
| Mobile Home / Other | 114 | 46.9% |
| Total | 243 | 100.0% |
Housing Structures by Occupancy in Chamberino
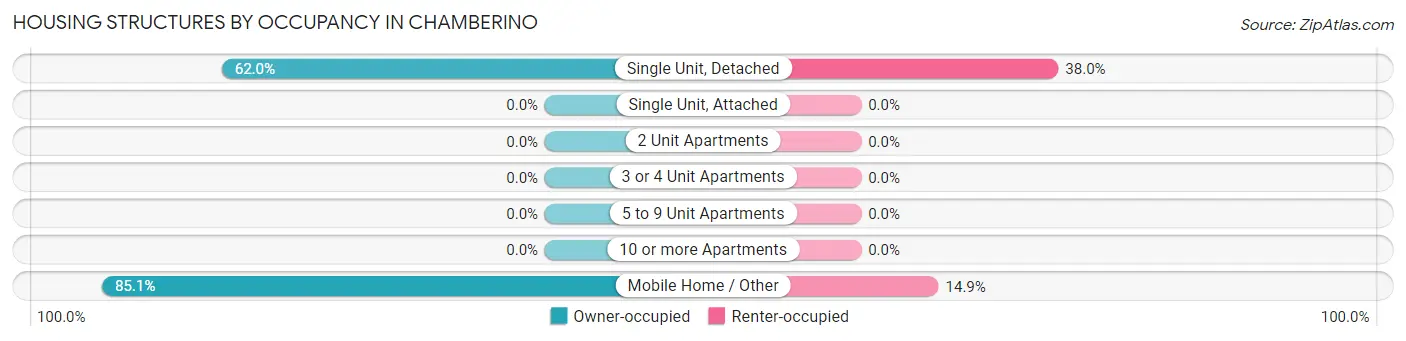
| Structure Type | Owner-occupied | Renter-occupied |
| Single Unit, Detached | 80 (62.0%) | 49 (38.0%) |
| Single Unit, Attached | 0 (0.0%) | 0 (0.0%) |
| 2 Unit Apartments | 0 (0.0%) | 0 (0.0%) |
| 3 or 4 Unit Apartments | 0 (0.0%) | 0 (0.0%) |
| 5 to 9 Unit Apartments | 0 (0.0%) | 0 (0.0%) |
| 10 or more Apartments | 0 (0.0%) | 0 (0.0%) |
| Mobile Home / Other | 97 (85.1%) | 17 (14.9%) |
| Total | 177 (72.8%) | 66 (27.2%) |
Housing Structures by Number of Rooms in Chamberino
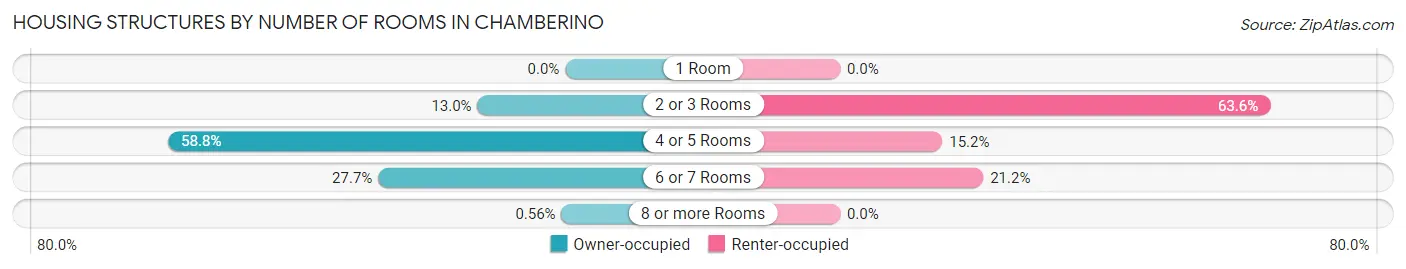
| Number of Rooms | Owner-occupied | Renter-occupied |
| 1 Room | 0 (0.0%) | 0 (0.0%) |
| 2 or 3 Rooms | 23 (13.0%) | 42 (63.6%) |
| 4 or 5 Rooms | 104 (58.8%) | 10 (15.1%) |
| 6 or 7 Rooms | 49 (27.7%) | 14 (21.2%) |
| 8 or more Rooms | 1 (0.6%) | 0 (0.0%) |
| Total | 177 (100.0%) | 66 (100.0%) |
Housing Structure by Heating Type in Chamberino
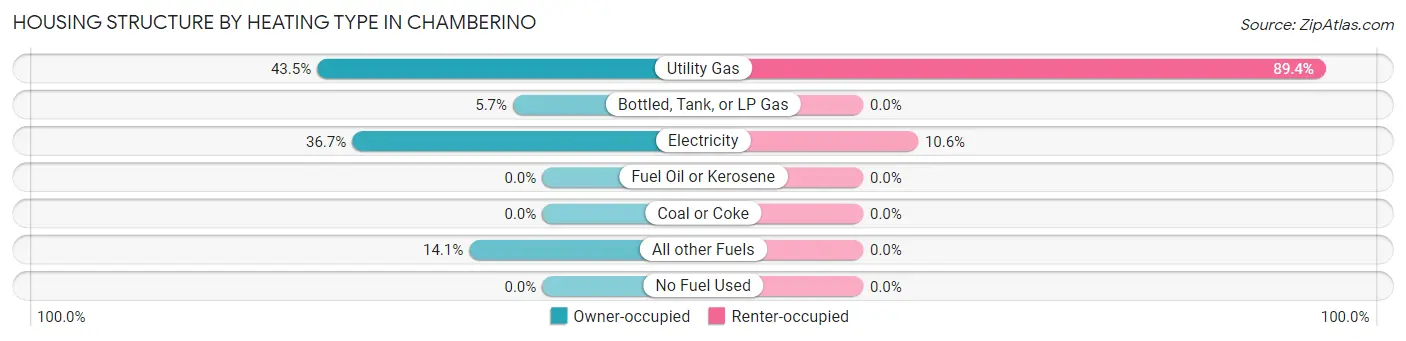
| Heating Type | Owner-occupied | Renter-occupied |
| Utility Gas | 77 (43.5%) | 59 (89.4%) |
| Bottled, Tank, or LP Gas | 10 (5.7%) | 0 (0.0%) |
| Electricity | 65 (36.7%) | 7 (10.6%) |
| Fuel Oil or Kerosene | 0 (0.0%) | 0 (0.0%) |
| Coal or Coke | 0 (0.0%) | 0 (0.0%) |
| All other Fuels | 25 (14.1%) | 0 (0.0%) |
| No Fuel Used | 0 (0.0%) | 0 (0.0%) |
| Total | 177 (100.0%) | 66 (100.0%) |
Household Vehicle Usage in Chamberino
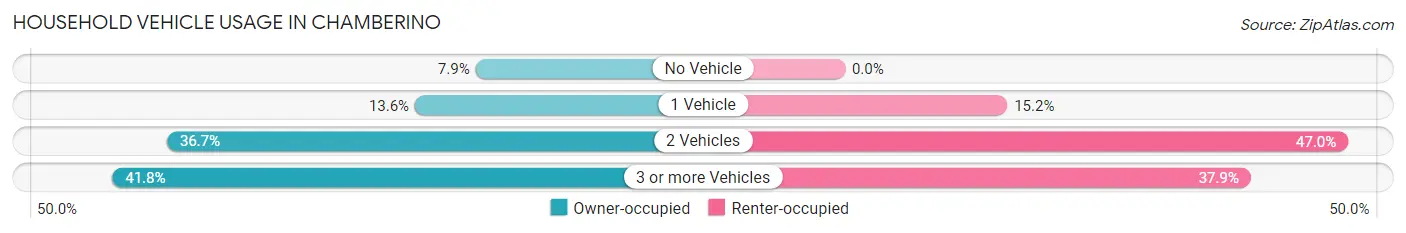
| Vehicles per Household | Owner-occupied | Renter-occupied |
| No Vehicle | 14 (7.9%) | 0 (0.0%) |
| 1 Vehicle | 24 (13.6%) | 10 (15.1%) |
| 2 Vehicles | 65 (36.7%) | 31 (47.0%) |
| 3 or more Vehicles | 74 (41.8%) | 25 (37.9%) |
| Total | 177 (100.0%) | 66 (100.0%) |
Real Estate & Mortgages in Chamberino
Real Estate and Mortgage Overview in Chamberino
| Characteristic | Without Mortgage | With Mortgage |
| Housing Units | 150 | 27 |
| Median Property Value | $200,000 | $0 |
| Median Household Income | - | - |
| Monthly Housing Costs | $251 | $0 |
| Real Estate Taxes | $506 | $0 |
Property Value by Mortgage Status in Chamberino
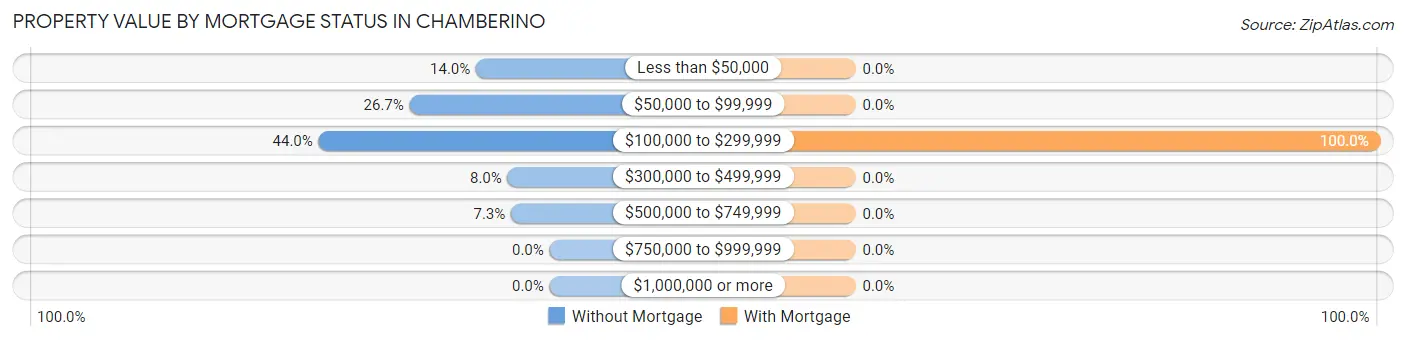
| Property Value | Without Mortgage | With Mortgage |
| Less than $50,000 | 21 (14.0%) | 0 (0.0%) |
| $50,000 to $99,999 | 40 (26.7%) | 0 (0.0%) |
| $100,000 to $299,999 | 66 (44.0%) | 27 (100.0%) |
| $300,000 to $499,999 | 12 (8.0%) | 0 (0.0%) |
| $500,000 to $749,999 | 11 (7.3%) | 0 (0.0%) |
| $750,000 to $999,999 | 0 (0.0%) | 0 (0.0%) |
| $1,000,000 or more | 0 (0.0%) | 0 (0.0%) |
| Total | 150 (100.0%) | 27 (100.0%) |
Household Income by Mortgage Status in Chamberino
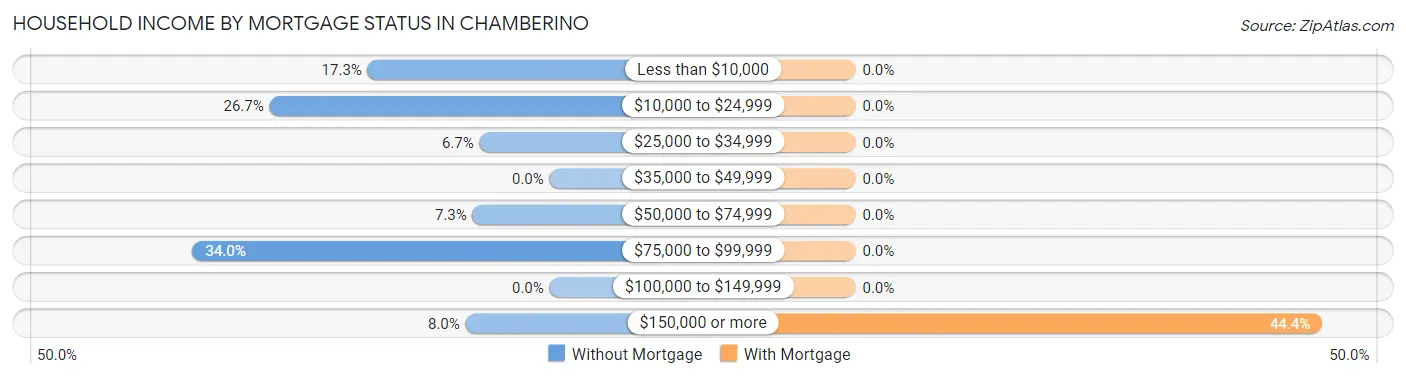
| Household Income | Without Mortgage | With Mortgage |
| Less than $10,000 | 26 (17.3%) | 0 (0.0%) |
| $10,000 to $24,999 | 40 (26.7%) | 0 (0.0%) |
| $25,000 to $34,999 | 10 (6.7%) | 0 (0.0%) |
| $35,000 to $49,999 | 0 (0.0%) | 0 (0.0%) |
| $50,000 to $74,999 | 11 (7.3%) | 0 (0.0%) |
| $75,000 to $99,999 | 51 (34.0%) | 0 (0.0%) |
| $100,000 to $149,999 | 0 (0.0%) | 0 (0.0%) |
| $150,000 or more | 12 (8.0%) | 12 (44.4%) |
| Total | 150 (100.0%) | 27 (100.0%) |
Property Value to Household Income Ratio in Chamberino
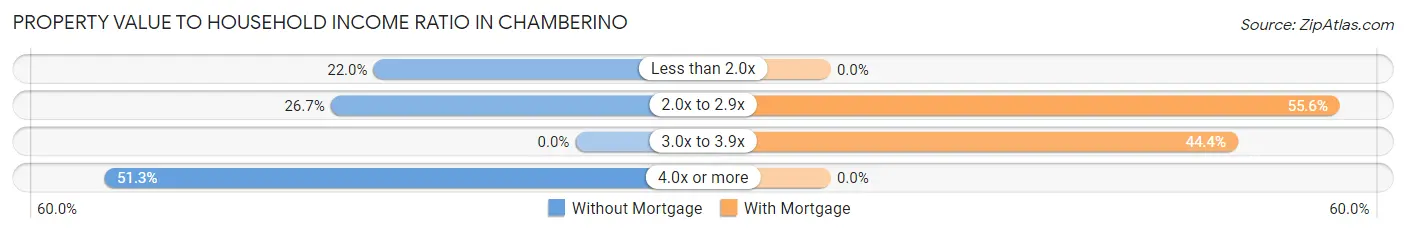
| Value-to-Income Ratio | Without Mortgage | With Mortgage |
| Less than 2.0x | 33 (22.0%) | 0 (0.0%) |
| 2.0x to 2.9x | 40 (26.7%) | 15 (55.6%) |
| 3.0x to 3.9x | 0 (0.0%) | 12 (44.4%) |
| 4.0x or more | 77 (51.3%) | 0 (0.0%) |
| Total | 150 (100.0%) | 27 (100.0%) |
Real Estate Taxes by Mortgage Status in Chamberino
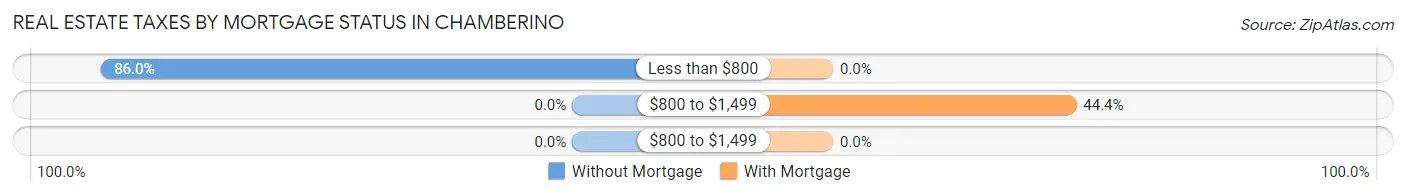
| Property Taxes | Without Mortgage | With Mortgage |
| Less than $800 | 129 (86.0%) | 0 (0.0%) |
| $800 to $1,499 | 0 (0.0%) | 12 (44.4%) |
| $800 to $1,499 | 0 (0.0%) | 0 (0.0%) |
| Total | 150 (100.0%) | 27 (100.0%) |
Health & Disability in Chamberino
Health Insurance Coverage by Age in Chamberino
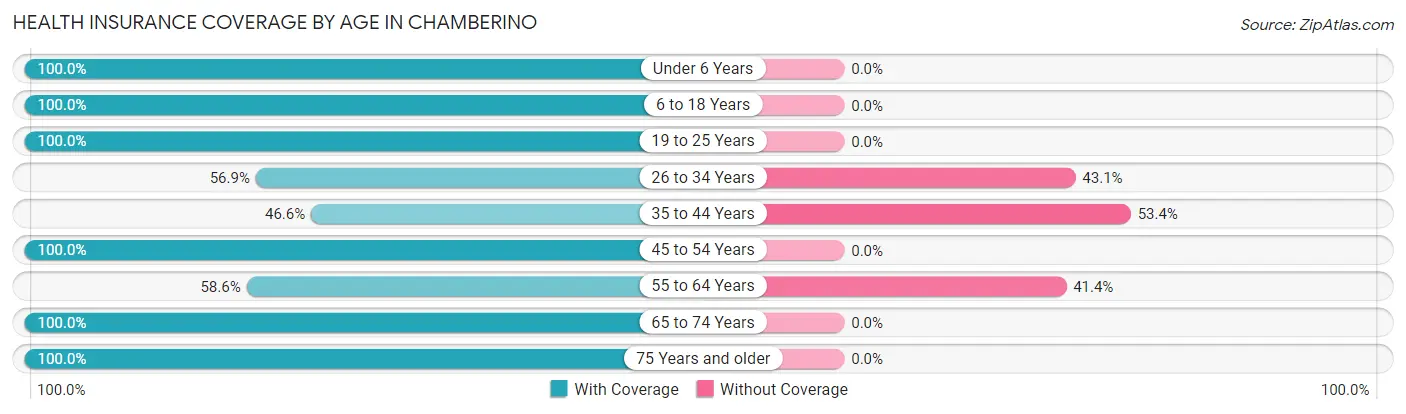
| Age Bracket | With Coverage | Without Coverage |
| Under 6 Years | 44 (100.0%) | 0 (0.0%) |
| 6 to 18 Years | 151 (100.0%) | 0 (0.0%) |
| 19 to 25 Years | 56 (100.0%) | 0 (0.0%) |
| 26 to 34 Years | 66 (56.9%) | 50 (43.1%) |
| 35 to 44 Years | 41 (46.6%) | 47 (53.4%) |
| 45 to 54 Years | 59 (100.0%) | 0 (0.0%) |
| 55 to 64 Years | 34 (58.6%) | 24 (41.4%) |
| 65 to 74 Years | 133 (100.0%) | 0 (0.0%) |
| 75 Years and older | 15 (100.0%) | 0 (0.0%) |
| Total | 599 (83.2%) | 121 (16.8%) |
Health Insurance Coverage by Citizenship Status in Chamberino
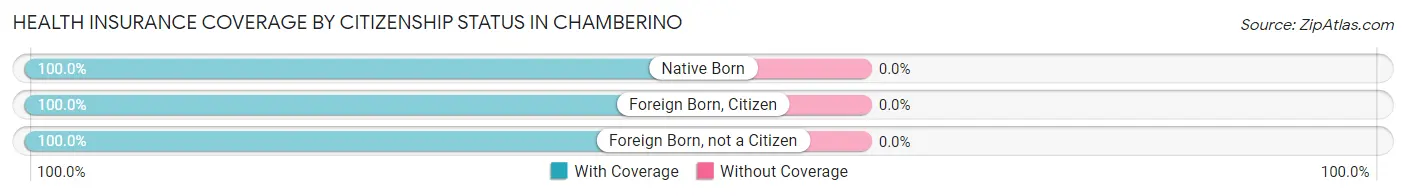
| Citizenship Status | With Coverage | Without Coverage |
| Native Born | 44 (100.0%) | 0 (0.0%) |
| Foreign Born, Citizen | 151 (100.0%) | 0 (0.0%) |
| Foreign Born, not a Citizen | 56 (100.0%) | 0 (0.0%) |
Health Insurance Coverage by Household Income in Chamberino
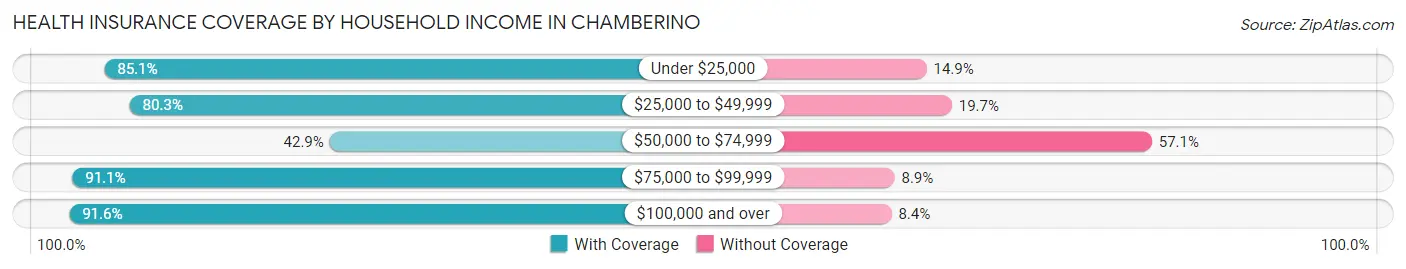
| Household Income | With Coverage | Without Coverage |
| Under $25,000 | 74 (85.1%) | 13 (14.9%) |
| $25,000 to $49,999 | 192 (80.3%) | 47 (19.7%) |
| $50,000 to $74,999 | 24 (42.9%) | 32 (57.1%) |
| $75,000 to $99,999 | 112 (91.1%) | 11 (8.9%) |
| $100,000 and over | 197 (91.6%) | 18 (8.4%) |
Public vs Private Health Insurance Coverage by Age in Chamberino
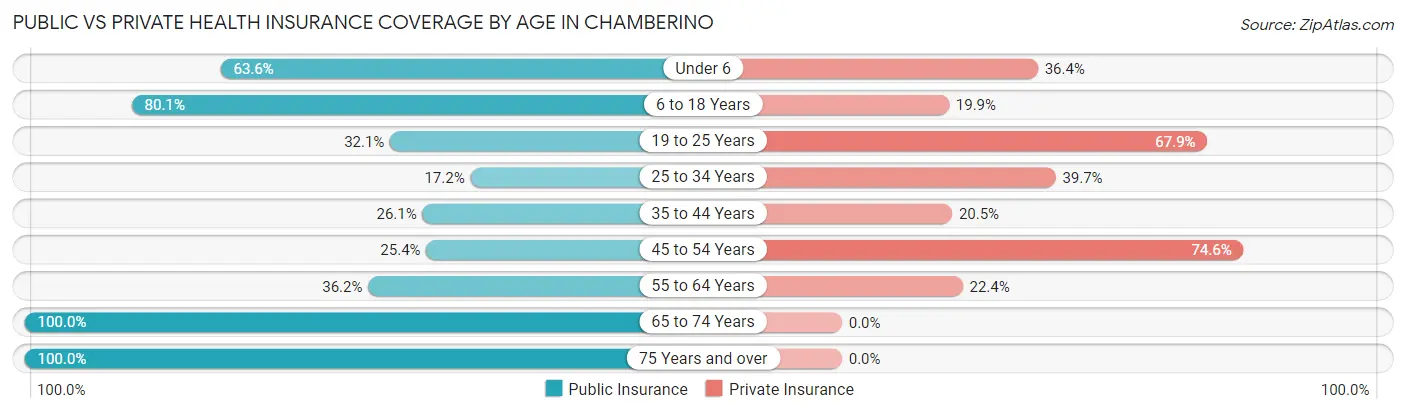
| Age Bracket | Public Insurance | Private Insurance |
| Under 6 | 28 (63.6%) | 16 (36.4%) |
| 6 to 18 Years | 121 (80.1%) | 30 (19.9%) |
| 19 to 25 Years | 18 (32.1%) | 38 (67.9%) |
| 25 to 34 Years | 20 (17.2%) | 46 (39.7%) |
| 35 to 44 Years | 23 (26.1%) | 18 (20.4%) |
| 45 to 54 Years | 15 (25.4%) | 44 (74.6%) |
| 55 to 64 Years | 21 (36.2%) | 13 (22.4%) |
| 65 to 74 Years | 133 (100.0%) | 0 (0.0%) |
| 75 Years and over | 15 (100.0%) | 0 (0.0%) |
| Total | 394 (54.7%) | 205 (28.5%) |
Disability Status by Sex by Age in Chamberino
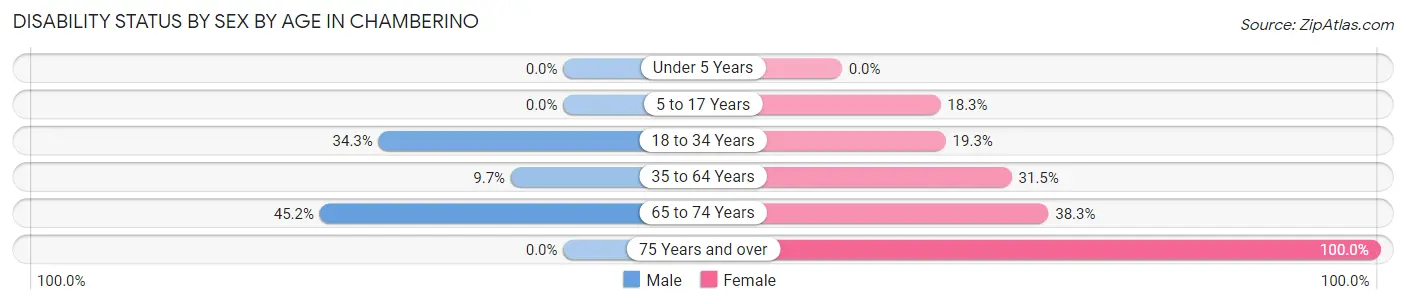
| Age Bracket | Male | Female |
| Under 5 Years | 0 (0.0%) | 0 (0.0%) |
| 5 to 17 Years | 0 (0.0%) | 15 (18.3%) |
| 18 to 34 Years | 36 (34.3%) | 16 (19.3%) |
| 35 to 64 Years | 11 (9.7%) | 29 (31.5%) |
| 65 to 74 Years | 33 (45.2%) | 23 (38.3%) |
| 75 Years and over | 0 (0.0%) | 14 (100.0%) |
Disability Class by Sex by Age in Chamberino
Disability Class: Hearing Difficulty
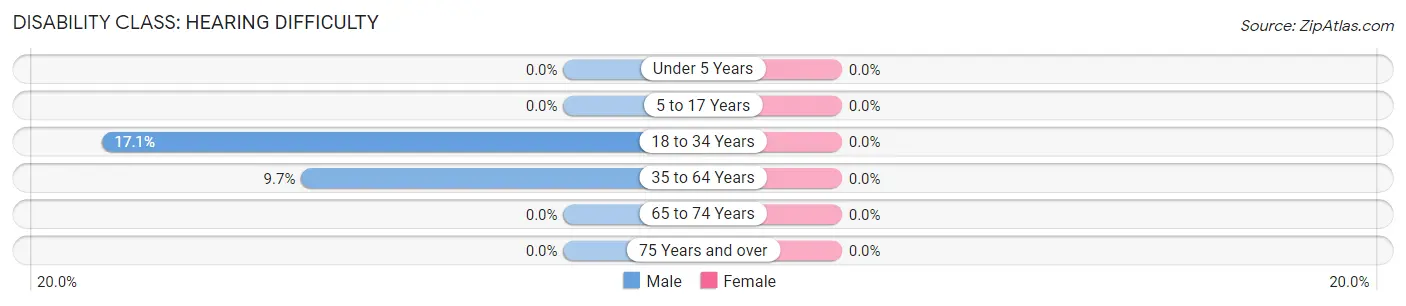
| Age Bracket | Male | Female |
| Under 5 Years | 0 (0.0%) | 0 (0.0%) |
| 5 to 17 Years | 0 (0.0%) | 0 (0.0%) |
| 18 to 34 Years | 18 (17.1%) | 0 (0.0%) |
| 35 to 64 Years | 11 (9.7%) | 0 (0.0%) |
| 65 to 74 Years | 0 (0.0%) | 0 (0.0%) |
| 75 Years and over | 0 (0.0%) | 0 (0.0%) |
Disability Class: Vision Difficulty
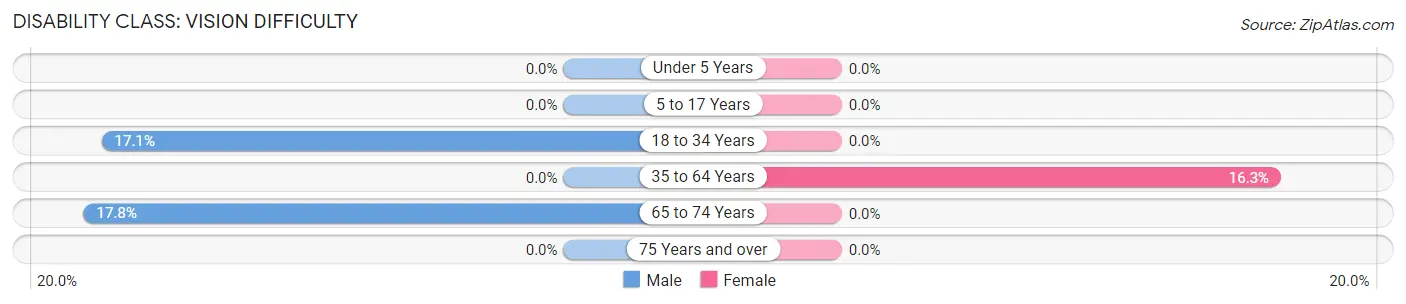
| Age Bracket | Male | Female |
| Under 5 Years | 0 (0.0%) | 0 (0.0%) |
| 5 to 17 Years | 0 (0.0%) | 0 (0.0%) |
| 18 to 34 Years | 18 (17.1%) | 0 (0.0%) |
| 35 to 64 Years | 0 (0.0%) | 15 (16.3%) |
| 65 to 74 Years | 13 (17.8%) | 0 (0.0%) |
| 75 Years and over | 0 (0.0%) | 0 (0.0%) |
Disability Class: Cognitive Difficulty
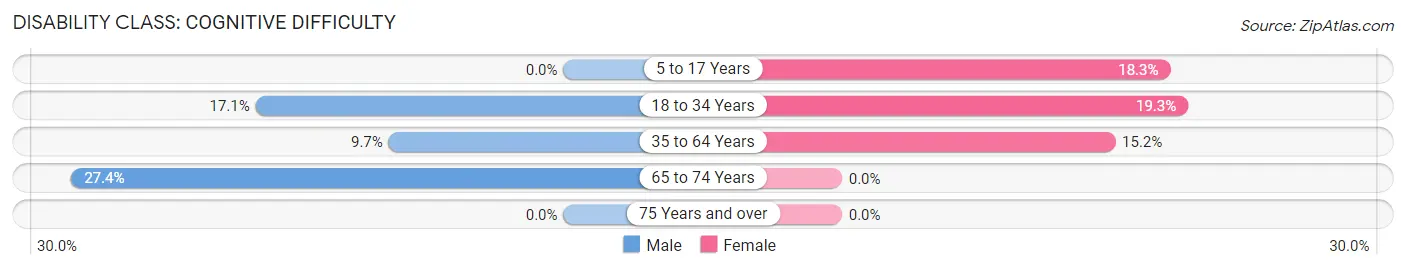
| Age Bracket | Male | Female |
| 5 to 17 Years | 0 (0.0%) | 15 (18.3%) |
| 18 to 34 Years | 18 (17.1%) | 16 (19.3%) |
| 35 to 64 Years | 11 (9.7%) | 14 (15.2%) |
| 65 to 74 Years | 20 (27.4%) | 0 (0.0%) |
| 75 Years and over | 0 (0.0%) | 0 (0.0%) |
Disability Class: Ambulatory Difficulty
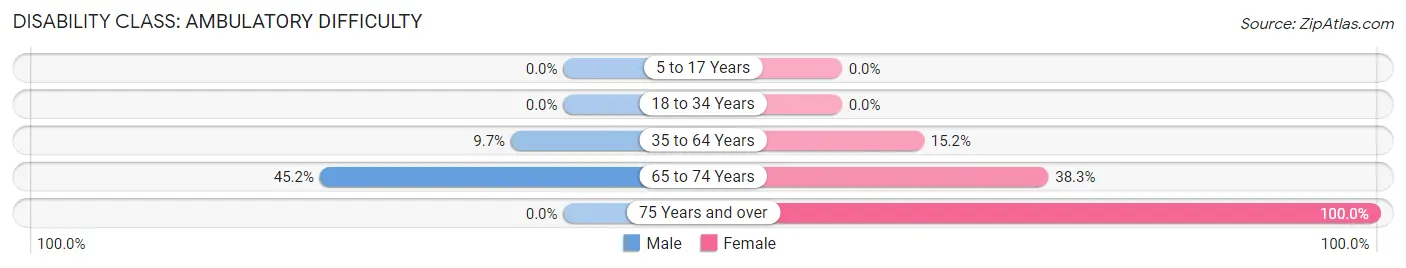
| Age Bracket | Male | Female |
| 5 to 17 Years | 0 (0.0%) | 0 (0.0%) |
| 18 to 34 Years | 0 (0.0%) | 0 (0.0%) |
| 35 to 64 Years | 11 (9.7%) | 14 (15.2%) |
| 65 to 74 Years | 33 (45.2%) | 23 (38.3%) |
| 75 Years and over | 0 (0.0%) | 14 (100.0%) |
Disability Class: Self-Care Difficulty
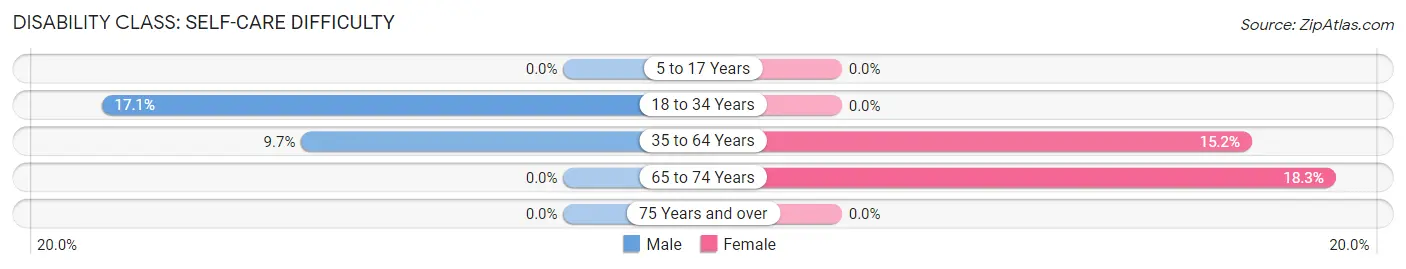
| Age Bracket | Male | Female |
| 5 to 17 Years | 0 (0.0%) | 0 (0.0%) |
| 18 to 34 Years | 18 (17.1%) | 0 (0.0%) |
| 35 to 64 Years | 11 (9.7%) | 14 (15.2%) |
| 65 to 74 Years | 0 (0.0%) | 11 (18.3%) |
| 75 Years and over | 0 (0.0%) | 0 (0.0%) |
Technology Access in Chamberino
Computing Device Access in Chamberino
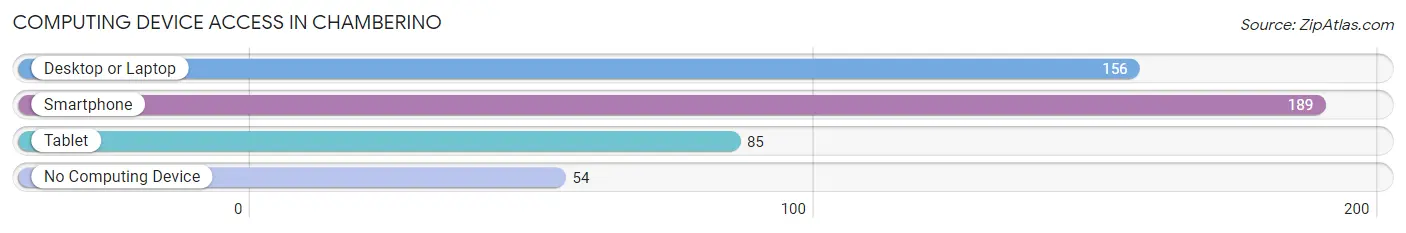
| Device Type | # Households | % Households |
| Desktop or Laptop | 156 | 64.2% |
| Smartphone | 189 | 77.8% |
| Tablet | 85 | 35.0% |
| No Computing Device | 54 | 22.2% |
| Total | 243 | 100.0% |
Internet Access in Chamberino
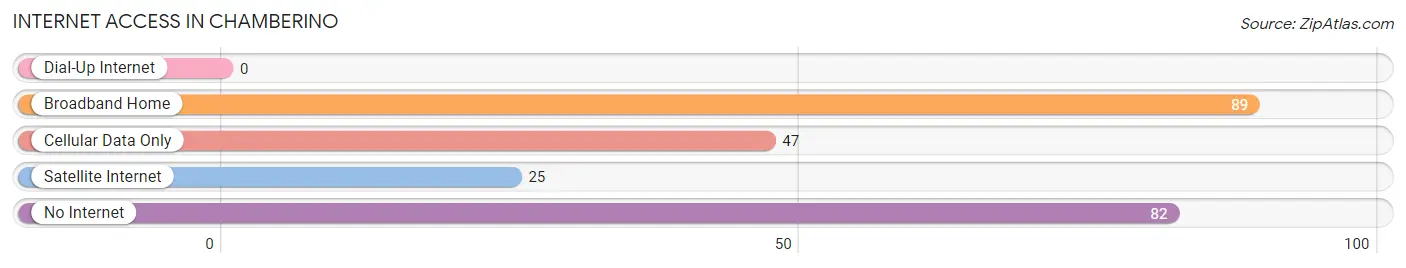
| Internet Type | # Households | % Households |
| Dial-Up Internet | 0 | 0.0% |
| Broadband Home | 89 | 36.6% |
| Cellular Data Only | 47 | 19.3% |
| Satellite Internet | 25 | 10.3% |
| No Internet | 82 | 33.7% |
| Total | 243 | 100.0% |
Chamberino Summary
Chamberino is a small unincorporated community located in Doña Ana County, New Mexico. It is situated in the Mesilla Valley, approximately 15 miles northwest of Las Cruces. The population of Chamberino was 1,072 at the 2010 census.
History
Chamberino was founded in 1883 by a group of Mexican settlers who were looking for a place to settle and farm. The town was named after a local rancher, Don Francisco Chamberino. The town was originally located on the banks of the Rio Grande, but was moved to its current location in the early 1900s due to flooding.
Geography
Chamberino is located in the Mesilla Valley, which is a large alluvial valley located in the southern part of New Mexico. The valley is bordered by the Rio Grande to the east and the Organ Mountains to the west. The climate in the area is semi-arid, with hot summers and mild winters.
Economy
The economy of Chamberino is largely based on agriculture. The town is home to several farms and ranches, which produce a variety of crops, including cotton, alfalfa, and chile peppers. The town is also home to several small businesses, including a grocery store, a gas station, and a restaurant.
Demographics
As of the 2010 census, the population of Chamberino was 1,072. The racial makeup of the town was 73.3% Hispanic or Latino, 24.2% White, 0.7% Native American, 0.2% Asian, and 1.6% from other races. The median household income was $25,938, and the median age was 33.
Conclusion
Chamberino is a small unincorporated community located in Doña Ana County, New Mexico. It was founded in 1883 by a group of Mexican settlers and is situated in the Mesilla Valley. The economy of Chamberino is largely based on agriculture, and the town is home to several small businesses. The population of Chamberino was 1,072 at the 2010 census, and the racial makeup of the town was 73.3% Hispanic or Latino, 24.2% White, 0.7% Native American, 0.2% Asian, and 1.6% from other races.
Common Questions
What is the Total Population of Chamberino?
Total Population of Chamberino is 720.
What is the Total Male Population of Chamberino?
Total Male Population of Chamberino is 376.
What is the Total Female Population of Chamberino?
Total Female Population of Chamberino is 344.
What is the Ratio of Males per 100 Females in Chamberino?
There are 109.30 Males per 100 Females in Chamberino.
What is the Ratio of Females per 100 Males in Chamberino?
There are 91.49 Females per 100 Males in Chamberino.
What is the Median Population Age in Chamberino?
Median Population Age in Chamberino is 34.5 Years.
What is the Average Family Size in Chamberino
Average Family Size in Chamberino is 3.7 People.
What is the Average Household Size in Chamberino
Average Household Size in Chamberino is 3.0 People.
What is Per Capita Income in Chamberino?
Per Capita income in Chamberino is $23,887.
What is the Median Family Income in Chamberino?
Median Family Income in Chamberino is $76,438.
What is Inequality or Gini Index in Chamberino?
Inequality or Gini Index in Chamberino is 0.48.
How Large is the Labor Force in Chamberino?
There are 317 People in the Labor Forcein in Chamberino.
What is the Percentage of People in the Labor Force in Chamberino?
57.1% of People are in the Labor Force in Chamberino.
What is the Unemployment Rate in Chamberino?
Unemployment Rate in Chamberino is 4.7%.