Zip Codes with the Highest Percentage of Households with Income Above $200,000 in Hawaii
RELATED REPORTS & OPTIONS
Household Income | $200k+
Hawaii
Compare Zip Codes
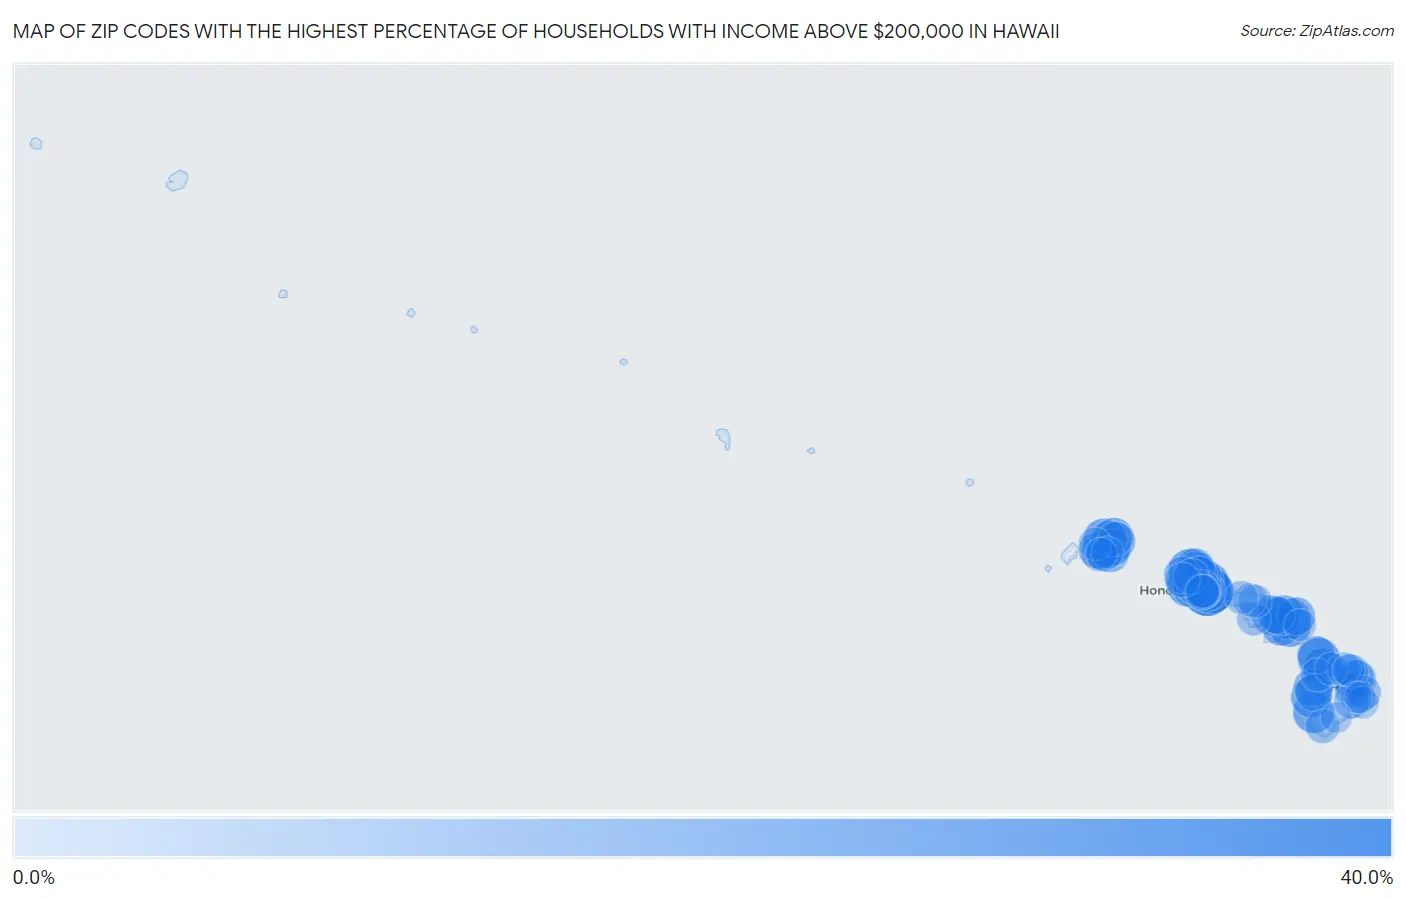
Map of Zip Codes with the Highest Percentage of Households with Income Above $200,000 in Hawaii
0.0%
40.0%
Zip Codes with the Highest Percentage of Households with Income Above $200,000 in Hawaii
| Zip Code | Households with Income > $200k | vs State | vs National | |
| 1. | 96821 | 37.7% | 15.9%(+21.8)#1 | 11.4%(+26.3)#790 |
| 2. | 96825 | 28.3% | 15.9%(+12.4)#2 | 11.4%(+16.9)#1,680 |
| 3. | 96734 | 26.4% | 15.9%(+10.5)#3 | 11.4%(+15.0)#1,959 |
| 4. | 96795 | 25.2% | 15.9%(+9.30)#4 | 11.4%(+13.8)#2,154 |
| 5. | 96744 | 23.9% | 15.9%(+8.00)#5 | 11.4%(+12.5)#2,388 |
| 6. | 96712 | 23.3% | 15.9%(+7.40)#6 | 11.4%(+11.9)#2,501 |
| 7. | 96755 | 22.7% | 15.9%(+6.80)#7 | 11.4%(+11.3)#2,637 |
| 8. | 96816 | 22.4% | 15.9%(+6.50)#8 | 11.4%(+11.0)#2,688 |
| 9. | 96701 | 22.0% | 15.9%(+6.10)#9 | 11.4%(+10.6)#2,769 |
| 10. | 96790 | 21.3% | 15.9%(+5.40)#10 | 11.4%(+9.90)#2,943 |
| 11. | 96704 | 21.1% | 15.9%(+5.20)#11 | 11.4%(+9.70)#3,006 |
| 12. | 96768 | 20.7% | 15.9%(+4.80)#12 | 11.4%(+9.30)#3,110 |
| 13. | 96819 | 20.1% | 15.9%(+4.20)#13 | 11.4%(+8.70)#3,247 |
| 14. | 96707 | 19.9% | 15.9%(+4.00)#14 | 11.4%(+8.50)#3,305 |
| 15. | 96714 | 19.7% | 15.9%(+3.80)#15 | 11.4%(+8.30)#3,379 |
| 16. | 96750 | 19.5% | 15.9%(+3.60)#16 | 11.4%(+8.10)#3,443 |
| 17. | 96706 | 18.4% | 15.9%(+2.50)#17 | 11.4%(+7.00)#3,718 |
| 18. | 96789 | 18.4% | 15.9%(+2.50)#18 | 11.4%(+7.00)#3,721 |
| 19. | 96754 | 17.9% | 15.9%(+2.00)#19 | 11.4%(+6.50)#3,887 |
| 20. | 96822 | 17.8% | 15.9%(+1.90)#20 | 11.4%(+6.40)#3,899 |
| 21. | 96761 | 17.8% | 15.9%(+1.90)#21 | 11.4%(+6.40)#3,904 |
| 22. | 96779 | 17.7% | 15.9%(+1.80)#22 | 11.4%(+6.30)#3,944 |
| 23. | 96730 | 17.5% | 15.9%(+1.60)#23 | 11.4%(+6.10)#4,029 |
| 24. | 96743 | 17.1% | 15.9%(+1.20)#24 | 11.4%(+5.70)#4,155 |
| 25. | 96753 | 16.5% | 15.9%(+0.600)#25 | 11.4%(+5.10)#4,372 |
| 26. | 96782 | 16.2% | 15.9%(+0.300)#26 | 11.4%(+4.80)#4,479 |
| 27. | 96762 | 16.0% | 15.9%(+0.100)#27 | 11.4%(+4.60)#4,578 |
| 28. | 96797 | 15.5% | 15.9%(-0.400)#28 | 11.4%(+4.10)#4,746 |
| 29. | 96813 | 15.1% | 15.9%(-0.800)#29 | 11.4%(+3.70)#4,938 |
| 30. | 96741 | 15.1% | 15.9%(-0.800)#30 | 11.4%(+3.70)#4,951 |
| 31. | 96731 | 15.1% | 15.9%(-0.800)#31 | 11.4%(+3.70)#4,958 |
| 32. | 96732 | 15.0% | 15.9%(-0.900)#32 | 11.4%(+3.60)#4,981 |
| 33. | 96740 | 14.9% | 15.9%(-1.00)#33 | 11.4%(+3.50)#5,024 |
| 34. | 96746 | 14.6% | 15.9%(-1.30)#34 | 11.4%(+3.20)#5,182 |
| 35. | 96719 | 14.5% | 15.9%(-1.40)#35 | 11.4%(+3.10)#5,238 |
| 36. | 96717 | 14.4% | 15.9%(-1.50)#36 | 11.4%(+3.00)#5,277 |
| 37. | 96708 | 14.3% | 15.9%(-1.60)#37 | 11.4%(+2.90)#5,313 |
| 38. | 96747 | 13.9% | 15.9%(-2.00)#38 | 11.4%(+2.50)#5,543 |
| 39. | 96756 | 13.8% | 15.9%(-2.10)#39 | 11.4%(+2.40)#5,584 |
| 40. | 96793 | 13.7% | 15.9%(-2.20)#40 | 11.4%(+2.30)#5,618 |
| 41. | 96796 | 13.7% | 15.9%(-2.20)#41 | 11.4%(+2.30)#5,653 |
| 42. | 96725 | 13.5% | 15.9%(-2.40)#42 | 11.4%(+2.10)#5,757 |
| 43. | 96766 | 13.4% | 15.9%(-2.50)#43 | 11.4%(+2.00)#5,794 |
| 44. | 96817 | 13.2% | 15.9%(-2.70)#44 | 11.4%(+1.80)#5,887 |
| 45. | 96818 | 13.1% | 15.9%(-2.80)#45 | 11.4%(+1.70)#5,943 |
| 46. | 96783 | 13.1% | 15.9%(-2.80)#46 | 11.4%(+1.70)#5,984 |
| 47. | 96791 | 12.5% | 15.9%(-3.40)#47 | 11.4%(+1.10)#6,361 |
| 48. | 96722 | 12.3% | 15.9%(-3.60)#48 | 11.4%(+0.900)#6,507 |
| 49. | 96814 | 10.9% | 15.9%(-5.00)#49 | 11.4%(-0.500)#7,486 |
| 50. | 96781 | 10.5% | 15.9%(-5.40)#50 | 11.4%(-0.900)#7,825 |
| 51. | 96728 | 10.3% | 15.9%(-5.60)#51 | 11.4%(-1.10)#8,026 |
| 52. | 96720 | 9.3% | 15.9%(-6.60)#52 | 11.4%(-2.10)#8,924 |
| 53. | 96786 | 9.3% | 15.9%(-6.60)#53 | 11.4%(-2.10)#8,927 |
| 54. | 96815 | 9.0% | 15.9%(-6.90)#54 | 11.4%(-2.40)#9,219 |
| 55. | 96705 | 9.0% | 15.9%(-6.90)#55 | 11.4%(-2.40)#9,271 |
| 56. | 96792 | 8.8% | 15.9%(-7.10)#56 | 11.4%(-2.60)#9,410 |
| 57. | 96785 | 8.5% | 15.9%(-7.40)#57 | 11.4%(-2.90)#9,793 |
| 58. | 96703 | 8.3% | 15.9%(-7.60)#58 | 11.4%(-3.10)#10,049 |
| 59. | 96749 | 7.7% | 15.9%(-8.20)#59 | 11.4%(-3.70)#10,777 |
| 60. | 96772 | 7.3% | 15.9%(-8.60)#60 | 11.4%(-4.10)#11,408 |
| 61. | 96780 | 7.0% | 15.9%(-8.90)#61 | 11.4%(-4.40)#11,882 |
| 62. | 96763 | 6.5% | 15.9%(-9.40)#62 | 11.4%(-4.90)#12,626 |
| 63. | 96757 | 6.0% | 15.9%(-9.90)#63 | 11.4%(-5.40)#13,585 |
| 64. | 96748 | 5.9% | 15.9%(-10.00)#64 | 11.4%(-5.50)#13,716 |
| 65. | 96826 | 5.6% | 15.9%(-10.3)#65 | 11.4%(-5.80)#14,275 |
| 66. | 96738 | 5.6% | 15.9%(-10.3)#66 | 11.4%(-5.80)#14,322 |
| 67. | 96729 | 5.4% | 15.9%(-10.5)#67 | 11.4%(-6.00)#14,806 |
| 68. | 96776 | 5.3% | 15.9%(-10.6)#68 | 11.4%(-6.10)#15,006 |
| 69. | 96727 | 4.7% | 15.9%(-11.2)#69 | 11.4%(-6.70)#16,380 |
| 70. | 96752 | 4.5% | 15.9%(-11.4)#70 | 11.4%(-6.90)#16,870 |
| 71. | 96765 | 3.9% | 15.9%(-12.0)#71 | 11.4%(-7.50)#18,536 |
| 72. | 96778 | 3.6% | 15.9%(-12.3)#72 | 11.4%(-7.80)#19,190 |
| 73. | 96764 | 3.6% | 15.9%(-12.3)#73 | 11.4%(-7.80)#19,388 |
| 74. | 96713 | 3.5% | 15.9%(-12.4)#74 | 11.4%(-7.90)#19,638 |
| 75. | 96716 | 3.1% | 15.9%(-12.8)#75 | 11.4%(-8.30)#20,744 |
| 76. | 96771 | 2.7% | 15.9%(-13.2)#76 | 11.4%(-8.70)#21,793 |
| 77. | 96760 | 2.6% | 15.9%(-13.3)#77 | 11.4%(-8.80)#22,142 |
| 78. | 96777 | 2.2% | 15.9%(-13.7)#78 | 11.4%(-9.20)#23,328 |
1
Common Questions
What are the Top 10 Zip Codes with the Highest Percentage of Households with Income Above $200,000 in Hawaii?
Top 10 Zip Codes with the Highest Percentage of Households with Income Above $200,000 in Hawaii are:
What zip code has the Highest Percentage of Households with Income Above $200,000 in Hawaii?
96821 has the Highest Percentage of Households with Income Above $200,000 in Hawaii with 37.7%.
What is the Percentage of Households with Income Above $200,000 in the State of Hawaii?
Percentage of Households with Income Above $200,000 in Hawaii is 15.9%.
What is the Percentage of Households with Income Above $200,000 in the United States?
Percentage of Households with Income Above $200,000 in the United States is 11.4%.