Zip Codes with the Highest Percentage of Households with Income Above $200,000 in New York
RELATED REPORTS & OPTIONS
Household Income | $200k+
New York
Compare Zip Codes
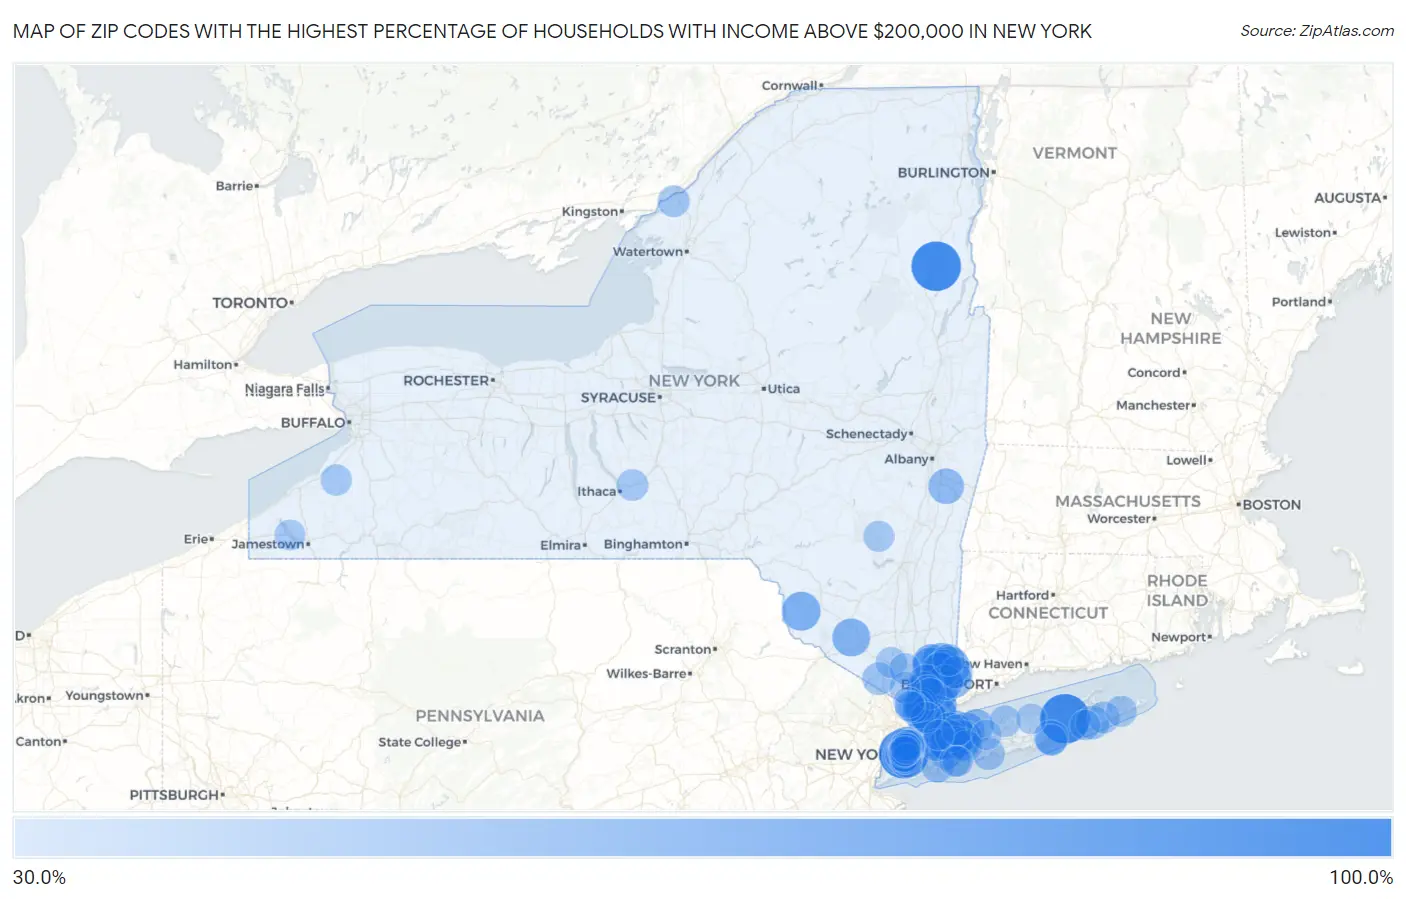
Map of Zip Codes with the Highest Percentage of Households with Income Above $200,000 in New York
0.0%
100.0%
Zip Codes with the Highest Percentage of Households with Income Above $200,000 in New York
| Zip Code | Households with Income > $200k | vs State | vs National | |
| 1. | 10279 | 100.0% | 15.2%(+84.8)#1 | 11.4%(+88.6)#5 |
| 2. | 11947 | 100.0% | 15.2%(+84.8)#2 | 11.4%(+88.6)#7 |
| 3. | 12872 | 100.0% | 15.2%(+84.8)#3 | 11.4%(+88.6)#9 |
| 4. | 10577 | 70.4% | 15.2%(+55.2)#4 | 11.4%(+59.0)#54 |
| 5. | 10282 | 69.8% | 15.2%(+54.6)#5 | 11.4%(+58.4)#55 |
| 6. | 10007 | 67.4% | 15.2%(+52.2)#6 | 11.4%(+56.0)#67 |
| 7. | 10597 | 66.0% | 15.2%(+50.8)#7 | 11.4%(+54.6)#72 |
| 8. | 10578 | 64.7% | 15.2%(+49.5)#8 | 11.4%(+53.3)#82 |
| 9. | 12720 | 64.6% | 15.2%(+49.4)#9 | 11.4%(+53.2)#84 |
| 10. | 10514 | 64.0% | 15.2%(+48.8)#10 | 11.4%(+52.6)#89 |
| 11. | 10932 | 61.9% | 15.2%(+46.7)#11 | 11.4%(+50.5)#100 |
| 12. | 11568 | 61.8% | 15.2%(+46.6)#12 | 11.4%(+50.4)#101 |
| 13. | 10501 | 61.0% | 15.2%(+45.8)#13 | 11.4%(+49.6)#107 |
| 14. | 10504 | 59.9% | 15.2%(+44.7)#14 | 11.4%(+48.5)#119 |
| 15. | 11724 | 59.6% | 15.2%(+44.4)#15 | 11.4%(+48.2)#123 |
| 16. | 10527 | 58.3% | 15.2%(+43.1)#16 | 11.4%(+46.9)#127 |
| 17. | 10502 | 58.2% | 15.2%(+43.0)#17 | 11.4%(+46.8)#128 |
| 18. | 11030 | 57.9% | 15.2%(+42.7)#18 | 11.4%(+46.5)#131 |
| 19. | 10004 | 57.9% | 15.2%(+42.7)#19 | 11.4%(+46.5)#132 |
| 20. | 11765 | 57.9% | 15.2%(+42.7)#20 | 11.4%(+46.5)#134 |
| 21. | 10576 | 57.3% | 15.2%(+42.1)#21 | 11.4%(+45.9)#143 |
| 22. | 10583 | 57.0% | 15.2%(+41.8)#22 | 11.4%(+45.6)#146 |
| 23. | 10580 | 56.0% | 15.2%(+40.8)#23 | 11.4%(+44.6)#160 |
| 24. | 10526 | 55.7% | 15.2%(+40.5)#24 | 11.4%(+44.3)#168 |
| 25. | 11576 | 55.5% | 15.2%(+40.3)#25 | 11.4%(+44.1)#171 |
| 26. | 10536 | 54.7% | 15.2%(+39.5)#26 | 11.4%(+43.3)#180 |
| 27. | 10506 | 54.7% | 15.2%(+39.5)#27 | 11.4%(+43.3)#181 |
| 28. | 12132 | 54.5% | 15.2%(+39.3)#28 | 11.4%(+43.1)#185 |
| 29. | 10538 | 53.6% | 15.2%(+38.4)#29 | 11.4%(+42.2)#200 |
| 30. | 10803 | 53.1% | 15.2%(+37.9)#30 | 11.4%(+41.7)#213 |
| 31. | 10804 | 52.8% | 15.2%(+37.6)#31 | 11.4%(+41.4)#219 |
| 32. | 10006 | 52.5% | 15.2%(+37.3)#32 | 11.4%(+41.1)#225 |
| 33. | 11972 | 51.4% | 15.2%(+36.2)#33 | 11.4%(+40.0)#245 |
| 34. | 11721 | 50.5% | 15.2%(+35.3)#34 | 11.4%(+39.1)#267 |
| 35. | 10280 | 50.3% | 15.2%(+35.1)#35 | 11.4%(+38.9)#271 |
| 36. | 10510 | 49.5% | 15.2%(+34.3)#36 | 11.4%(+38.1)#297 |
| 37. | 11797 | 49.2% | 15.2%(+34.0)#37 | 11.4%(+37.8)#303 |
| 38. | 10546 | 49.2% | 15.2%(+34.0)#38 | 11.4%(+37.8)#304 |
| 39. | 10533 | 49.0% | 15.2%(+33.8)#39 | 11.4%(+37.6)#307 |
| 40. | 10005 | 48.5% | 15.2%(+33.3)#40 | 11.4%(+37.1)#312 |
| 41. | 11976 | 48.2% | 15.2%(+33.0)#41 | 11.4%(+36.8)#321 |
| 42. | 11791 | 47.9% | 15.2%(+32.7)#42 | 11.4%(+36.5)#328 |
| 43. | 11530 | 47.8% | 15.2%(+32.6)#43 | 11.4%(+36.4)#333 |
| 44. | 10069 | 47.1% | 15.2%(+31.9)#44 | 11.4%(+35.7)#354 |
| 45. | 11579 | 45.3% | 15.2%(+30.1)#45 | 11.4%(+33.9)#418 |
| 46. | 10987 | 45.3% | 15.2%(+30.1)#46 | 11.4%(+33.9)#419 |
| 47. | 11598 | 45.0% | 15.2%(+29.8)#47 | 11.4%(+33.6)#426 |
| 48. | 11560 | 44.8% | 15.2%(+29.6)#48 | 11.4%(+33.4)#438 |
| 49. | 10590 | 44.5% | 15.2%(+29.3)#49 | 11.4%(+33.1)#445 |
| 50. | 11718 | 44.0% | 15.2%(+28.8)#50 | 11.4%(+32.6)#460 |
| 51. | 11753 | 43.8% | 15.2%(+28.6)#51 | 11.4%(+32.4)#465 |
| 52. | 11577 | 43.8% | 15.2%(+28.6)#52 | 11.4%(+32.4)#466 |
| 53. | 10570 | 43.7% | 15.2%(+28.5)#53 | 11.4%(+32.3)#471 |
| 54. | 10706 | 43.5% | 15.2%(+28.3)#54 | 11.4%(+32.1)#482 |
| 55. | 11020 | 43.5% | 15.2%(+28.3)#55 | 11.4%(+32.1)#483 |
| 56. | 11803 | 43.3% | 15.2%(+28.1)#56 | 11.4%(+31.9)#490 |
| 57. | 11545 | 43.3% | 15.2%(+28.1)#57 | 11.4%(+31.9)#492 |
| 58. | 11975 | 43.2% | 15.2%(+28.0)#58 | 11.4%(+31.8)#498 |
| 59. | 11215 | 43.1% | 15.2%(+27.9)#59 | 11.4%(+31.7)#499 |
| 60. | 11109 | 43.1% | 15.2%(+27.9)#60 | 11.4%(+31.7)#501 |
| 61. | 11804 | 43.1% | 15.2%(+27.9)#61 | 11.4%(+31.7)#503 |
| 62. | 10560 | 42.9% | 15.2%(+27.7)#62 | 11.4%(+31.5)#510 |
| 63. | 10022 | 42.4% | 15.2%(+27.2)#63 | 11.4%(+31.0)#529 |
| 64. | 13692 | 42.4% | 15.2%(+27.2)#64 | 11.4%(+31.0)#531 |
| 65. | 13062 | 42.3% | 15.2%(+27.1)#65 | 11.4%(+30.9)#535 |
| 66. | 10503 | 42.1% | 15.2%(+26.9)#66 | 11.4%(+30.7)#549 |
| 67. | 11733 | 41.9% | 15.2%(+26.7)#67 | 11.4%(+30.5)#554 |
| 68. | 11960 | 41.6% | 15.2%(+26.4)#68 | 11.4%(+30.2)#567 |
| 69. | 10024 | 41.4% | 15.2%(+26.2)#69 | 11.4%(+30.0)#574 |
| 70. | 11566 | 41.4% | 15.2%(+26.2)#70 | 11.4%(+30.0)#575 |
| 71. | 10028 | 41.3% | 15.2%(+26.1)#71 | 11.4%(+29.9)#579 |
| 72. | 10594 | 41.2% | 15.2%(+26.0)#72 | 11.4%(+29.8)#589 |
| 73. | 11771 | 41.1% | 15.2%(+25.9)#73 | 11.4%(+29.7)#595 |
| 74. | 10010 | 41.0% | 15.2%(+25.8)#74 | 11.4%(+29.6)#599 |
| 75. | 10964 | 40.9% | 15.2%(+25.7)#75 | 11.4%(+29.5)#607 |
| 76. | 11930 | 40.8% | 15.2%(+25.6)#76 | 11.4%(+29.4)#612 |
| 77. | 11201 | 40.7% | 15.2%(+25.5)#77 | 11.4%(+29.3)#613 |
| 78. | 10917 | 40.7% | 15.2%(+25.5)#78 | 11.4%(+29.3)#618 |
| 79. | 14168 | 40.7% | 15.2%(+25.5)#79 | 11.4%(+29.3)#619 |
| 80. | 10065 | 40.6% | 15.2%(+25.4)#80 | 11.4%(+29.2)#622 |
| 81. | 10709 | 40.5% | 15.2%(+25.3)#81 | 11.4%(+29.1)#631 |
| 82. | 10956 | 40.2% | 15.2%(+25.0)#82 | 11.4%(+28.8)#636 |
| 83. | 10986 | 40.2% | 15.2%(+25.0)#83 | 11.4%(+28.8)#641 |
| 84. | 10013 | 40.1% | 15.2%(+24.9)#84 | 11.4%(+28.7)#643 |
| 85. | 10962 | 40.1% | 15.2%(+24.9)#85 | 11.4%(+28.7)#644 |
| 86. | 10014 | 39.9% | 15.2%(+24.7)#86 | 11.4%(+28.5)#654 |
| 87. | 10021 | 39.7% | 15.2%(+24.5)#87 | 11.4%(+28.3)#660 |
| 88. | 11050 | 39.6% | 15.2%(+24.4)#88 | 11.4%(+28.2)#666 |
| 89. | 12450 | 39.6% | 15.2%(+24.4)#89 | 11.4%(+28.2)#671 |
| 90. | 14785 | 39.6% | 15.2%(+24.4)#90 | 11.4%(+28.2)#673 |
| 91. | 10023 | 39.4% | 15.2%(+24.2)#91 | 11.4%(+28.0)#677 |
| 92. | 10018 | 39.2% | 15.2%(+24.0)#92 | 11.4%(+27.8)#691 |
| 93. | 11217 | 39.0% | 15.2%(+23.8)#93 | 11.4%(+27.6)#706 |
| 94. | 10983 | 39.0% | 15.2%(+23.8)#94 | 11.4%(+27.6)#710 |
| 95. | 11710 | 38.9% | 15.2%(+23.7)#95 | 11.4%(+27.5)#714 |
| 96. | 10016 | 38.8% | 15.2%(+23.6)#96 | 11.4%(+27.4)#719 |
| 97. | 10003 | 38.7% | 15.2%(+23.5)#97 | 11.4%(+27.3)#727 |
| 98. | 11725 | 38.4% | 15.2%(+23.2)#98 | 11.4%(+27.0)#750 |
| 99. | 11968 | 38.3% | 15.2%(+23.1)#99 | 11.4%(+26.9)#755 |
| 100. | 11786 | 38.0% | 15.2%(+22.8)#100 | 11.4%(+26.6)#771 |
Common Questions
What are the Top 10 Zip Codes with the Highest Percentage of Households with Income Above $200,000 in New York?
Top 10 Zip Codes with the Highest Percentage of Households with Income Above $200,000 in New York are:
What zip code has the Highest Percentage of Households with Income Above $200,000 in New York?
10279 has the Highest Percentage of Households with Income Above $200,000 in New York with 100.0%.
What is the Percentage of Households with Income Above $200,000 in the State of New York?
Percentage of Households with Income Above $200,000 in New York is 15.2%.
What is the Percentage of Households with Income Above $200,000 in the United States?
Percentage of Households with Income Above $200,000 in the United States is 11.4%.