Zip Codes with the Highest Percentage of Population Employed in Security & Protection in Rochester, NH
RELATED REPORTS & OPTIONS
Security & Protection
Rochester
Compare Zip Codes
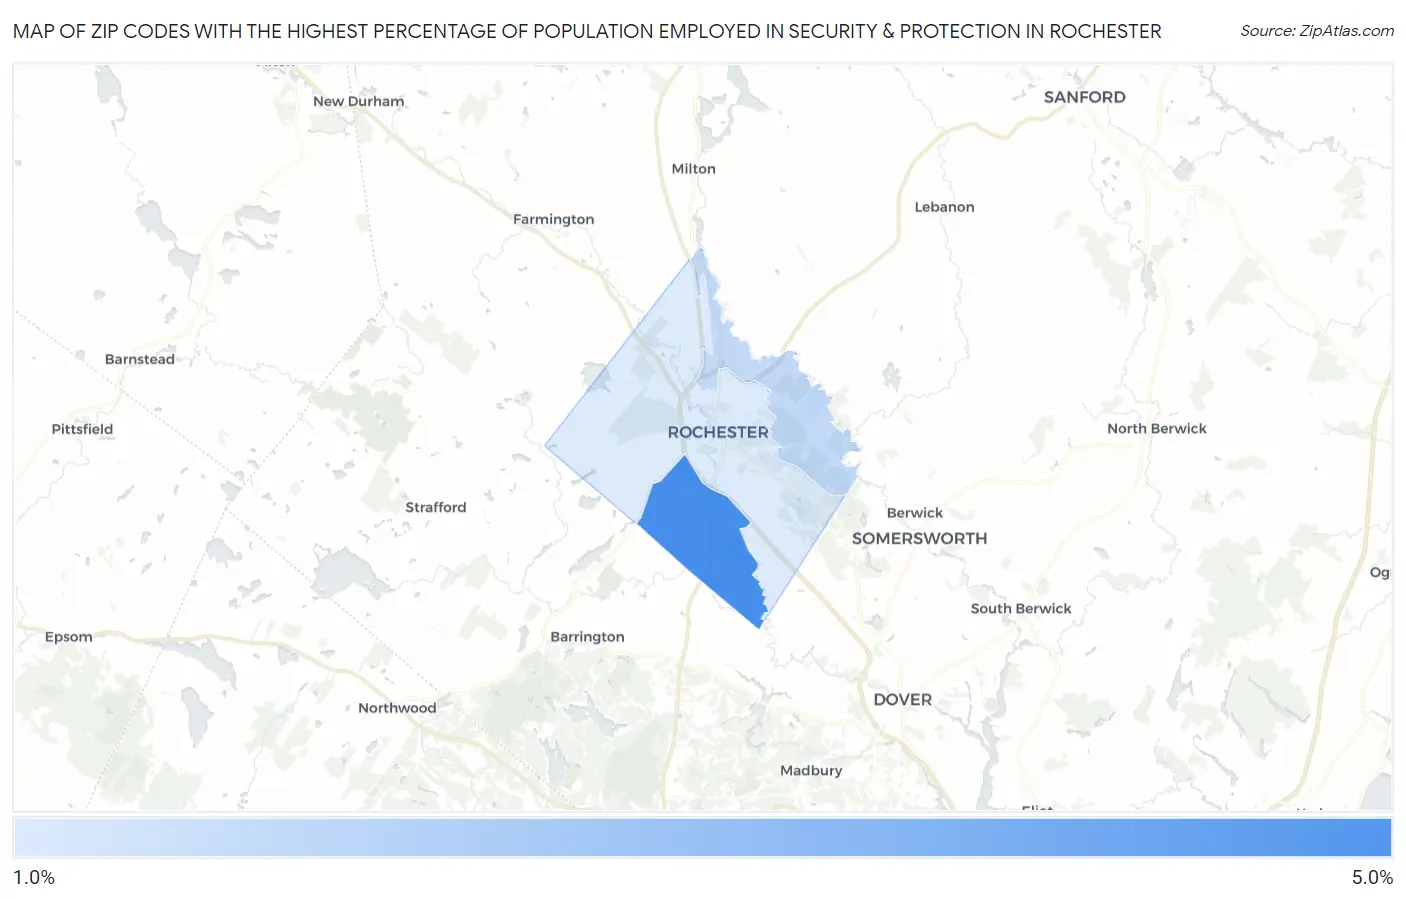
Map of Zip Codes with the Highest Percentage of Population Employed in Security & Protection in Rochester
0.0%
5.0%
Zip Codes with the Highest Percentage of Population Employed in Security & Protection in Rochester, NH
| Zip Code | % Employed | vs State | vs National | |
| 1. | 03839 | 4.7% | 1.6%(+3.07)#17 | 2.1%(+2.54)#3,319 |
| 2. | 03868 | 2.1% | 1.6%(+0.482)#69 | 2.1%(-0.044)#11,877 |
| 3. | 03867 | 1.5% | 1.6%(-0.114)#99 | 2.1%(-0.640)#16,125 |
1
Common Questions
What are the Top Zip Codes with the Highest Percentage of Population Employed in Security & Protection in Rochester, NH?
Top Zip Codes with the Highest Percentage of Population Employed in Security & Protection in Rochester, NH are:
What zip code has the Highest Percentage of Population Employed in Security & Protection in Rochester, NH?
03839 has the Highest Percentage of Population Employed in Security & Protection in Rochester, NH with 4.7%.
What is the Percentage of Population Employed in Security & Protection in Rochester, NH?
Percentage of Population Employed in Security & Protection in Rochester is 2.0%.
What is the Percentage of Population Employed in Security & Protection in New Hampshire?
Percentage of Population Employed in Security & Protection in New Hampshire is 1.6%.
What is the Percentage of Population Employed in Security & Protection in the United States?
Percentage of Population Employed in Security & Protection in the United States is 2.1%.