Zip Codes with the Highest Percentage of Population Employed in Food Preparation & Serving in Kinston, NC
RELATED REPORTS & OPTIONS
Food Preparation & Serving
Kinston
Compare Zip Codes
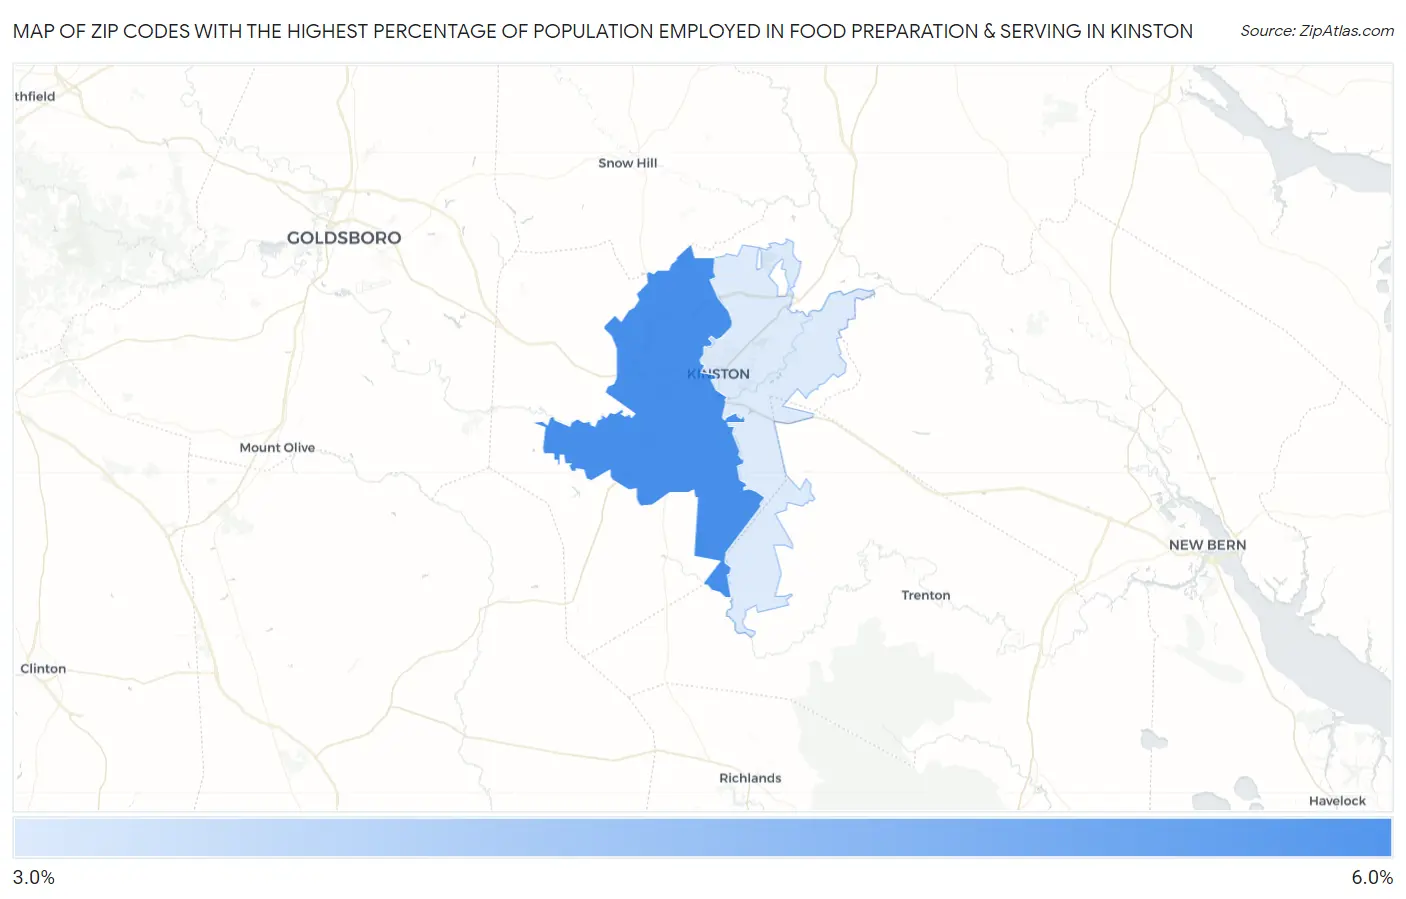
Map of Zip Codes with the Highest Percentage of Population Employed in Food Preparation & Serving in Kinston
0.0%
6.0%
Zip Codes with the Highest Percentage of Population Employed in Food Preparation & Serving in Kinston, NC
| Zip Code | % Employed | vs State | vs National | |
| 1. | 28504 | 5.3% | 5.3%(+0.021)#329 | 5.3%(+0.026)#11,719 |
| 2. | 28501 | 3.3% | 5.3%(-1.98)#551 | 5.3%(-1.97)#20,004 |
1
Common Questions
What are the Top Zip Codes with the Highest Percentage of Population Employed in Food Preparation & Serving in Kinston, NC?
Top Zip Codes with the Highest Percentage of Population Employed in Food Preparation & Serving in Kinston, NC are:
What zip code has the Highest Percentage of Population Employed in Food Preparation & Serving in Kinston, NC?
28504 has the Highest Percentage of Population Employed in Food Preparation & Serving in Kinston, NC with 5.3%.
What is the Percentage of Population Employed in Food Preparation & Serving in Kinston, NC?
Percentage of Population Employed in Food Preparation & Serving in Kinston is 3.7%.
What is the Percentage of Population Employed in Food Preparation & Serving in North Carolina?
Percentage of Population Employed in Food Preparation & Serving in North Carolina is 5.3%.
What is the Percentage of Population Employed in Food Preparation & Serving in the United States?
Percentage of Population Employed in Food Preparation & Serving in the United States is 5.3%.