Zip Codes with the Highest Percentage of Population Employed in Food Preparation & Serving in Charlotte, NC
RELATED REPORTS & OPTIONS
Food Preparation & Serving
Charlotte
Compare Zip Codes
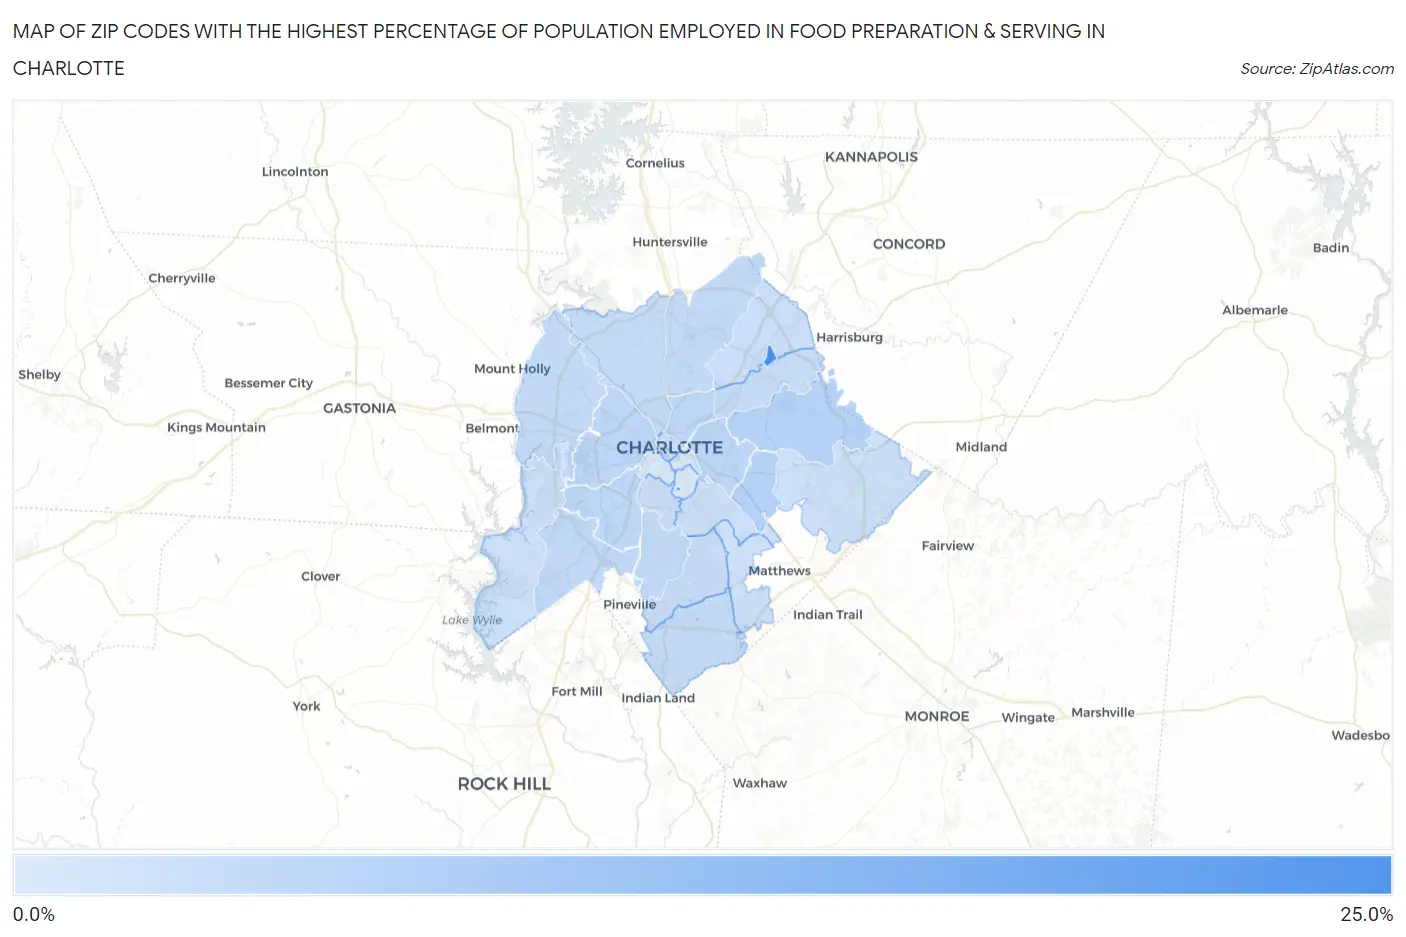
Map of Zip Codes with the Highest Percentage of Population Employed in Food Preparation & Serving in Charlotte
0.0%
25.0%
Zip Codes with the Highest Percentage of Population Employed in Food Preparation & Serving in Charlotte, NC
| Zip Code | % Employed | vs State | vs National | |
| 1. | 28223 | 24.6% | 5.3%(+19.3)#12 | 5.3%(+19.3)#322 |
| 2. | 28274 | 21.6% | 5.3%(+16.3)#13 | 5.3%(+16.3)#435 |
| 3. | 28215 | 7.0% | 5.3%(+1.69)#166 | 5.3%(+1.69)#6,614 |
| 4. | 28212 | 6.9% | 5.3%(+1.62)#172 | 5.3%(+1.62)#6,789 |
| 5. | 28208 | 6.0% | 5.3%(+0.671)#249 | 5.3%(+0.675)#9,470 |
| 6. | 28206 | 5.8% | 5.3%(+0.525)#268 | 5.3%(+0.529)#9,979 |
| 7. | 28205 | 5.7% | 5.3%(+0.397)#278 | 5.3%(+0.401)#10,399 |
| 8. | 28217 | 5.6% | 5.3%(+0.357)#290 | 5.3%(+0.362)#10,532 |
| 9. | 28273 | 5.2% | 5.3%(-0.109)#339 | 5.3%(-0.104)#12,232 |
| 10. | 28269 | 5.0% | 5.3%(-0.332)#366 | 5.3%(-0.328)#13,119 |
| 11. | 28214 | 4.8% | 5.3%(-0.483)#381 | 5.3%(-0.479)#13,734 |
| 12. | 28210 | 4.7% | 5.3%(-0.586)#394 | 5.3%(-0.581)#14,145 |
| 13. | 28216 | 4.4% | 5.3%(-0.870)#426 | 5.3%(-0.865)#15,329 |
| 14. | 28277 | 4.4% | 5.3%(-0.891)#429 | 5.3%(-0.886)#15,419 |
| 15. | 28213 | 4.4% | 5.3%(-0.912)#431 | 5.3%(-0.907)#15,513 |
| 16. | 28202 | 4.3% | 5.3%(-1.01)#441 | 5.3%(-1.01)#15,985 |
| 17. | 28226 | 4.1% | 5.3%(-1.19)#463 | 5.3%(-1.19)#16,716 |
| 18. | 28209 | 4.0% | 5.3%(-1.34)#477 | 5.3%(-1.33)#17,324 |
| 19. | 28262 | 3.7% | 5.3%(-1.54)#495 | 5.3%(-1.54)#18,144 |
| 20. | 28211 | 3.5% | 5.3%(-1.80)#526 | 5.3%(-1.79)#19,233 |
| 21. | 28278 | 3.4% | 5.3%(-1.89)#537 | 5.3%(-1.89)#19,626 |
| 22. | 28227 | 3.3% | 5.3%(-1.97)#549 | 5.3%(-1.96)#19,975 |
| 23. | 28270 | 3.3% | 5.3%(-1.99)#553 | 5.3%(-1.99)#20,066 |
| 24. | 28204 | 2.2% | 5.3%(-3.10)#650 | 5.3%(-3.09)#24,117 |
| 25. | 28203 | 1.8% | 5.3%(-3.49)#672 | 5.3%(-3.49)#25,263 |
| 26. | 28207 | 1.2% | 5.3%(-4.09)#694 | 5.3%(-4.09)#26,604 |
1
Common Questions
What are the Top 10 Zip Codes with the Highest Percentage of Population Employed in Food Preparation & Serving in Charlotte, NC?
Top 10 Zip Codes with the Highest Percentage of Population Employed in Food Preparation & Serving in Charlotte, NC are:
What zip code has the Highest Percentage of Population Employed in Food Preparation & Serving in Charlotte, NC?
28223 has the Highest Percentage of Population Employed in Food Preparation & Serving in Charlotte, NC with 24.6%.
What is the Percentage of Population Employed in Food Preparation & Serving in Charlotte, NC?
Percentage of Population Employed in Food Preparation & Serving in Charlotte is 4.8%.
What is the Percentage of Population Employed in Food Preparation & Serving in North Carolina?
Percentage of Population Employed in Food Preparation & Serving in North Carolina is 5.3%.
What is the Percentage of Population Employed in Food Preparation & Serving in the United States?
Percentage of Population Employed in Food Preparation & Serving in the United States is 5.3%.