Zip Codes with the Highest Percentage of Population Employed in Food Preparation & Serving in New Bern, NC
RELATED REPORTS & OPTIONS
Food Preparation & Serving
New Bern
Compare Zip Codes
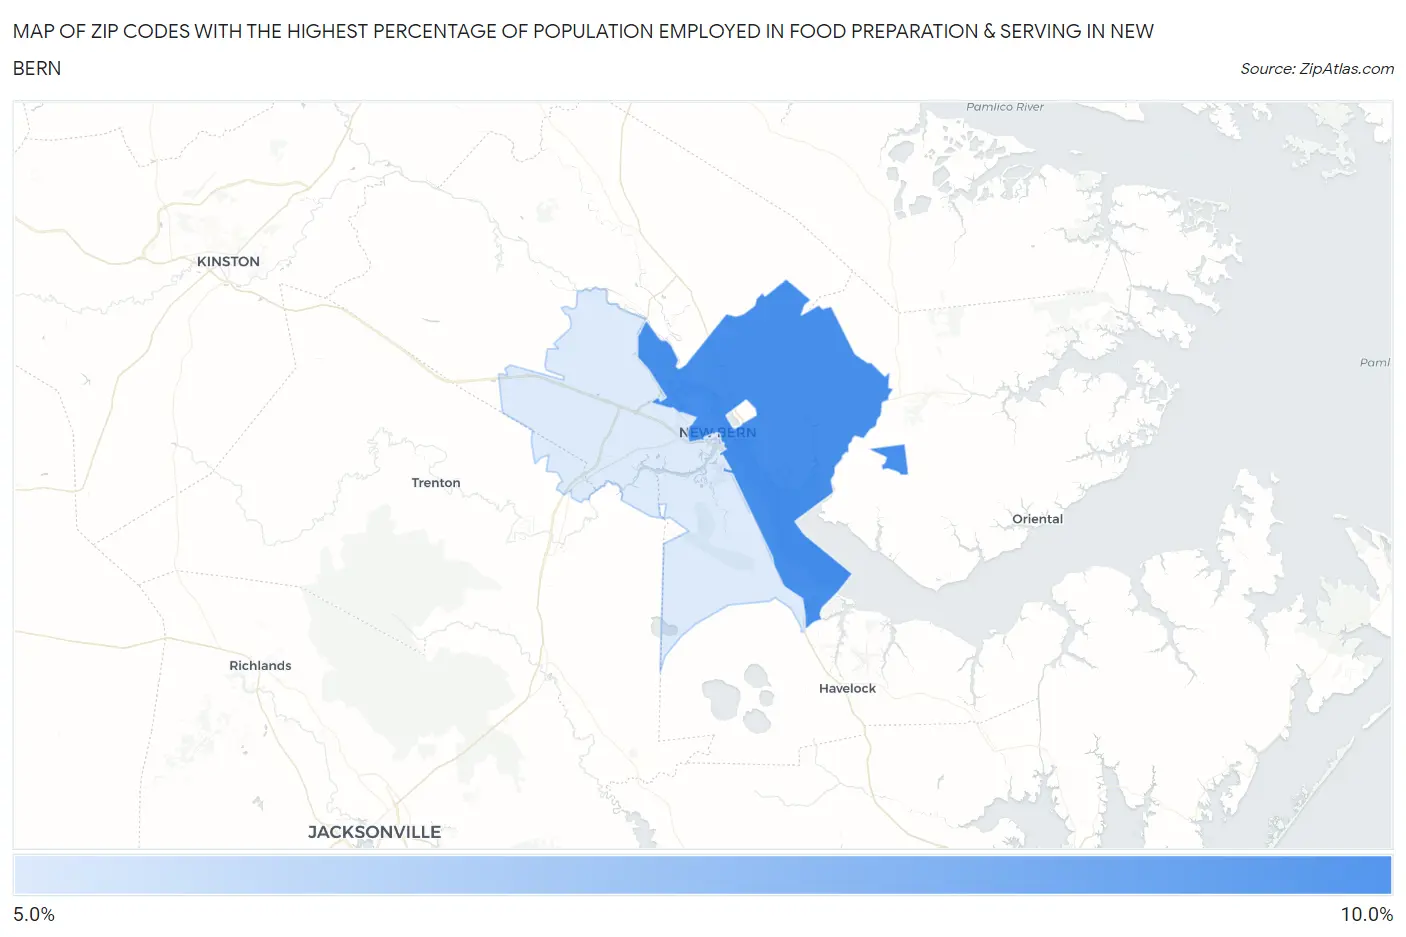
Map of Zip Codes with the Highest Percentage of Population Employed in Food Preparation & Serving in New Bern
0.0%
10.0%
Zip Codes with the Highest Percentage of Population Employed in Food Preparation & Serving in New Bern, NC
| Zip Code | % Employed | vs State | vs National | |
| 1. | 28560 | 9.0% | 5.3%(+3.74)#96 | 5.3%(+3.75)#3,491 |
| 2. | 28562 | 5.8% | 5.3%(+0.559)#261 | 5.3%(+0.563)#9,870 |
1
Common Questions
What are the Top Zip Codes with the Highest Percentage of Population Employed in Food Preparation & Serving in New Bern, NC?
Top Zip Codes with the Highest Percentage of Population Employed in Food Preparation & Serving in New Bern, NC are:
What zip code has the Highest Percentage of Population Employed in Food Preparation & Serving in New Bern, NC?
28560 has the Highest Percentage of Population Employed in Food Preparation & Serving in New Bern, NC with 9.0%.
What is the Percentage of Population Employed in Food Preparation & Serving in New Bern, NC?
Percentage of Population Employed in Food Preparation & Serving in New Bern is 8.6%.
What is the Percentage of Population Employed in Food Preparation & Serving in North Carolina?
Percentage of Population Employed in Food Preparation & Serving in North Carolina is 5.3%.
What is the Percentage of Population Employed in Food Preparation & Serving in the United States?
Percentage of Population Employed in Food Preparation & Serving in the United States is 5.3%.