Zip Codes with the Highest Percentage of Population Employed in Food Preparation & Serving in Gastonia, NC
RELATED REPORTS & OPTIONS
Food Preparation & Serving
Gastonia
Compare Zip Codes
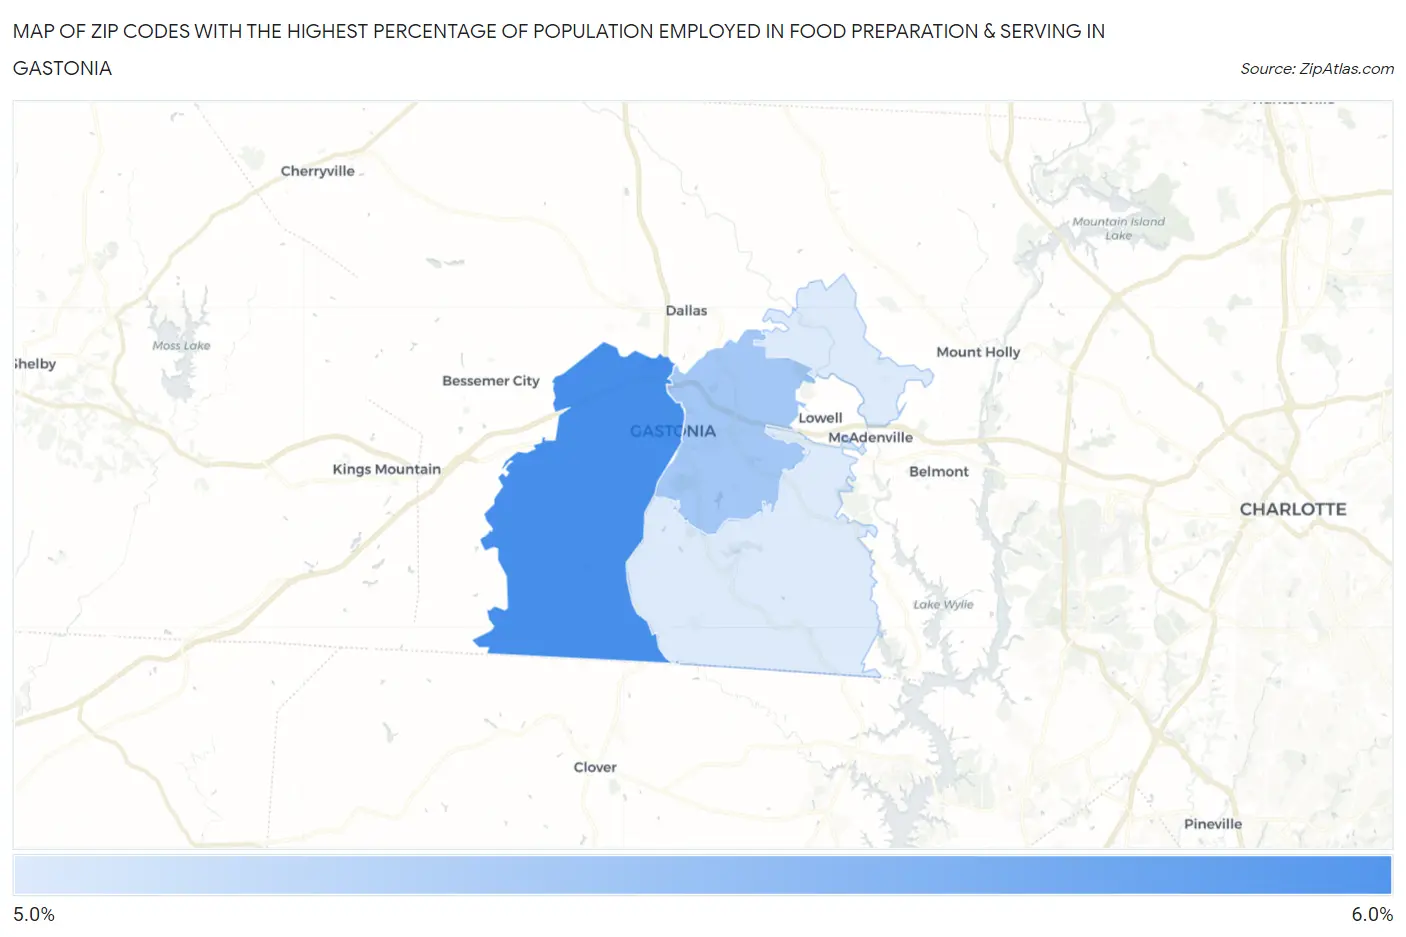
Map of Zip Codes with the Highest Percentage of Population Employed in Food Preparation & Serving in Gastonia
0.0%
6.0%
Zip Codes with the Highest Percentage of Population Employed in Food Preparation & Serving in Gastonia, NC
| Zip Code | % Employed | vs State | vs National | |
| 1. | 28052 | 5.7% | 5.3%(+0.450)#272 | 5.3%(+0.455)#10,205 |
| 2. | 28054 | 5.3% | 5.3%(+0.059)#322 | 5.3%(+0.063)#11,581 |
| 3. | 28056 | 5.1% | 5.3%(-0.191)#343 | 5.3%(-0.187)#12,549 |
1
Common Questions
What are the Top Zip Codes with the Highest Percentage of Population Employed in Food Preparation & Serving in Gastonia, NC?
Top Zip Codes with the Highest Percentage of Population Employed in Food Preparation & Serving in Gastonia, NC are:
What zip code has the Highest Percentage of Population Employed in Food Preparation & Serving in Gastonia, NC?
28052 has the Highest Percentage of Population Employed in Food Preparation & Serving in Gastonia, NC with 5.7%.
What is the Percentage of Population Employed in Food Preparation & Serving in Gastonia, NC?
Percentage of Population Employed in Food Preparation & Serving in Gastonia is 5.5%.
What is the Percentage of Population Employed in Food Preparation & Serving in North Carolina?
Percentage of Population Employed in Food Preparation & Serving in North Carolina is 5.3%.
What is the Percentage of Population Employed in Food Preparation & Serving in the United States?
Percentage of Population Employed in Food Preparation & Serving in the United States is 5.3%.