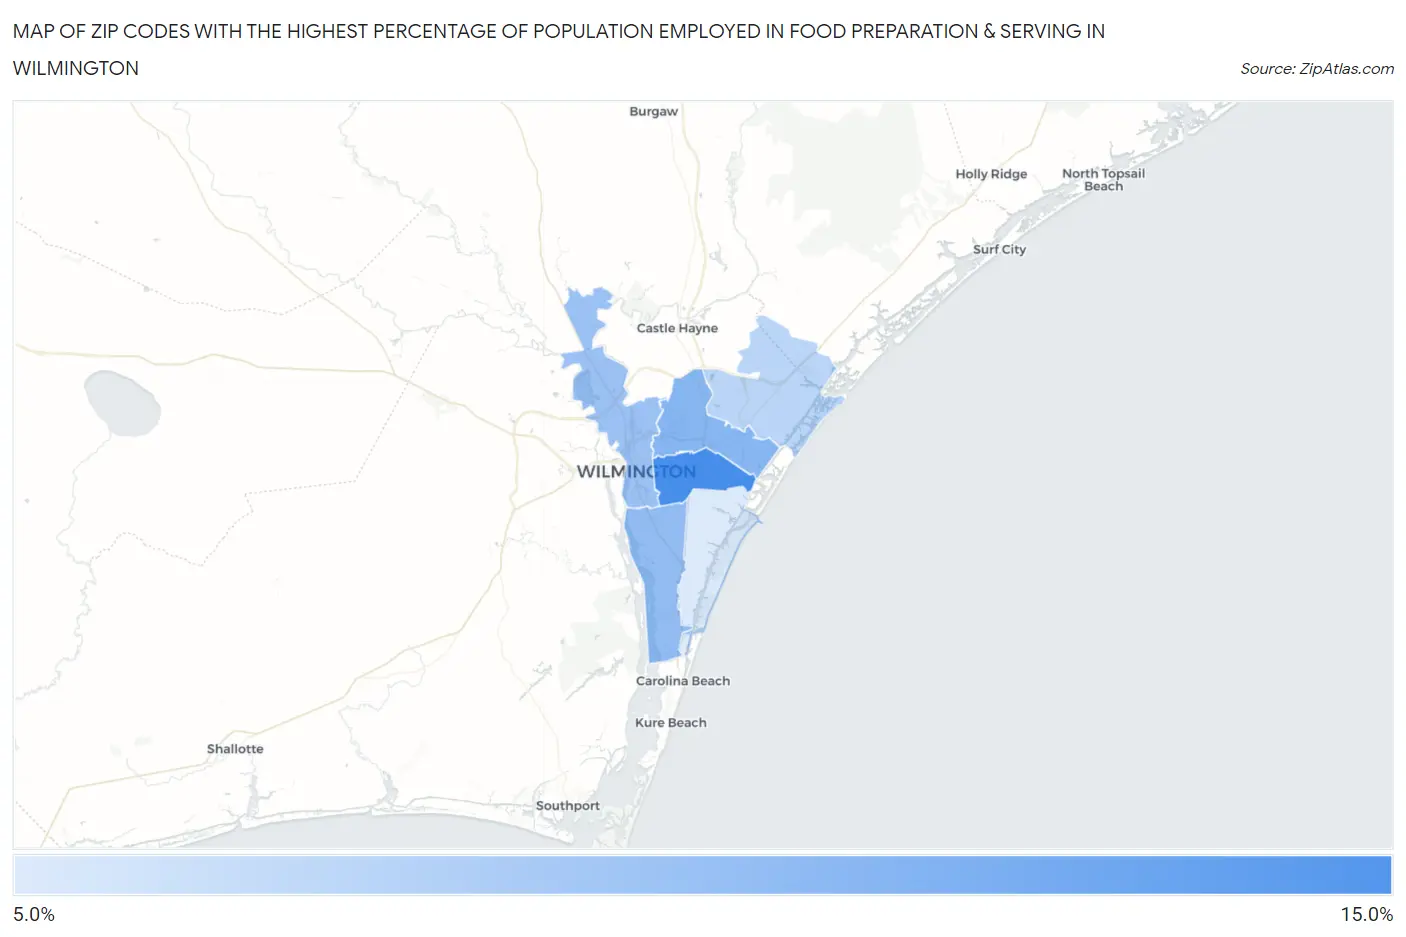
Zip Codes with the Highest Percentage of Population Employed in Food Preparation & Serving in Wilmington, NC
RELATED REPORTS & OPTIONS
Food Preparation & Serving
Wilmington
Compare Zip Codes
Map of Zip Codes with the Highest Percentage of Population Employed in Food Preparation & Serving in Wilmington
0.0%
15.0%
Zip Codes with the Highest Percentage of Population Employed in Food Preparation & Serving in Wilmington, NC
| Zip Code | % Employed | vs State | vs National | |
| 1. | 28403 | 10.7% | 5.3%(+5.36)#60 | 5.3%(+5.37)#2,231 |
| 2. | 28405 | 8.2% | 5.3%(+2.96)#118 | 5.3%(+2.96)#4,379 |
| 3. | 28412 | 7.8% | 5.3%(+2.52)#136 | 5.3%(+2.52)#5,036 |
| 4. | 28401 | 7.4% | 5.3%(+2.13)#150 | 5.3%(+2.13)#5,709 |
| 5. | 28411 | 6.3% | 5.3%(+0.990)#226 | 5.3%(+0.994)#8,487 |
| 6. | 28409 | 5.0% | 5.3%(-0.240)#352 | 5.3%(-0.236)#12,742 |
1
Common Questions
What are the Top 5 Zip Codes with the Highest Percentage of Population Employed in Food Preparation & Serving in Wilmington, NC?
Top 5 Zip Codes with the Highest Percentage of Population Employed in Food Preparation & Serving in Wilmington, NC are:
What zip code has the Highest Percentage of Population Employed in Food Preparation & Serving in Wilmington, NC?
28403 has the Highest Percentage of Population Employed in Food Preparation & Serving in Wilmington, NC with 10.7%.
What is the Percentage of Population Employed in Food Preparation & Serving in Wilmington, NC?
Percentage of Population Employed in Food Preparation & Serving in Wilmington is 8.8%.
What is the Percentage of Population Employed in Food Preparation & Serving in North Carolina?
Percentage of Population Employed in Food Preparation & Serving in North Carolina is 5.3%.
What is the Percentage of Population Employed in Food Preparation & Serving in the United States?
Percentage of Population Employed in Food Preparation & Serving in the United States is 5.3%.