Zip Codes with the Highest Percentage of Population Employed in Architecture & Engineering in Kinston, NC
RELATED REPORTS & OPTIONS
Architecture & Engineering
Kinston
Compare Zip Codes
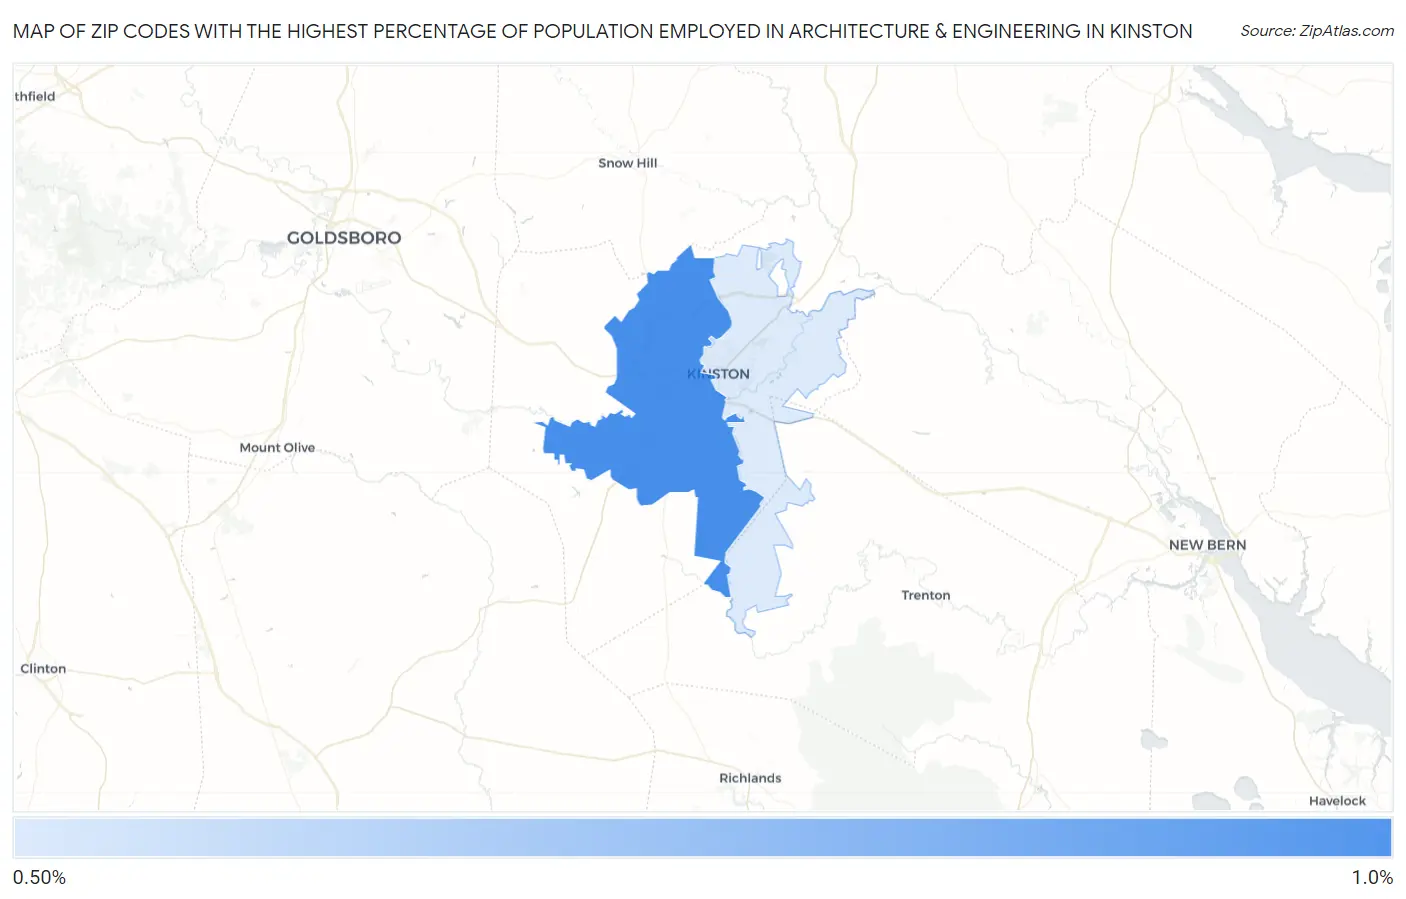
Map of Zip Codes with the Highest Percentage of Population Employed in Architecture & Engineering in Kinston
0.0%
1.0%
Zip Codes with the Highest Percentage of Population Employed in Architecture & Engineering in Kinston, NC
| Zip Code | % Employed | vs State | vs National | |
| 1. | 28504 | 0.88% | 1.9%(-1.01)#454 | 2.1%(-1.27)#17,547 |
| 2. | 28501 | 0.59% | 1.9%(-1.30)#509 | 2.1%(-1.56)#19,710 |
1
Common Questions
What are the Top Zip Codes with the Highest Percentage of Population Employed in Architecture & Engineering in Kinston, NC?
Top Zip Codes with the Highest Percentage of Population Employed in Architecture & Engineering in Kinston, NC are:
What zip code has the Highest Percentage of Population Employed in Architecture & Engineering in Kinston, NC?
28504 has the Highest Percentage of Population Employed in Architecture & Engineering in Kinston, NC with 0.88%.
What is the Percentage of Population Employed in Architecture & Engineering in Kinston, NC?
Percentage of Population Employed in Architecture & Engineering in Kinston is 0.65%.
What is the Percentage of Population Employed in Architecture & Engineering in North Carolina?
Percentage of Population Employed in Architecture & Engineering in North Carolina is 1.9%.
What is the Percentage of Population Employed in Architecture & Engineering in the United States?
Percentage of Population Employed in Architecture & Engineering in the United States is 2.1%.