Zip Codes with the Highest Percentage of Households Without a Vehicle in Kinston, NC
RELATED REPORTS & OPTIONS
Households without a Cars
Kinston
Compare Zip Codes
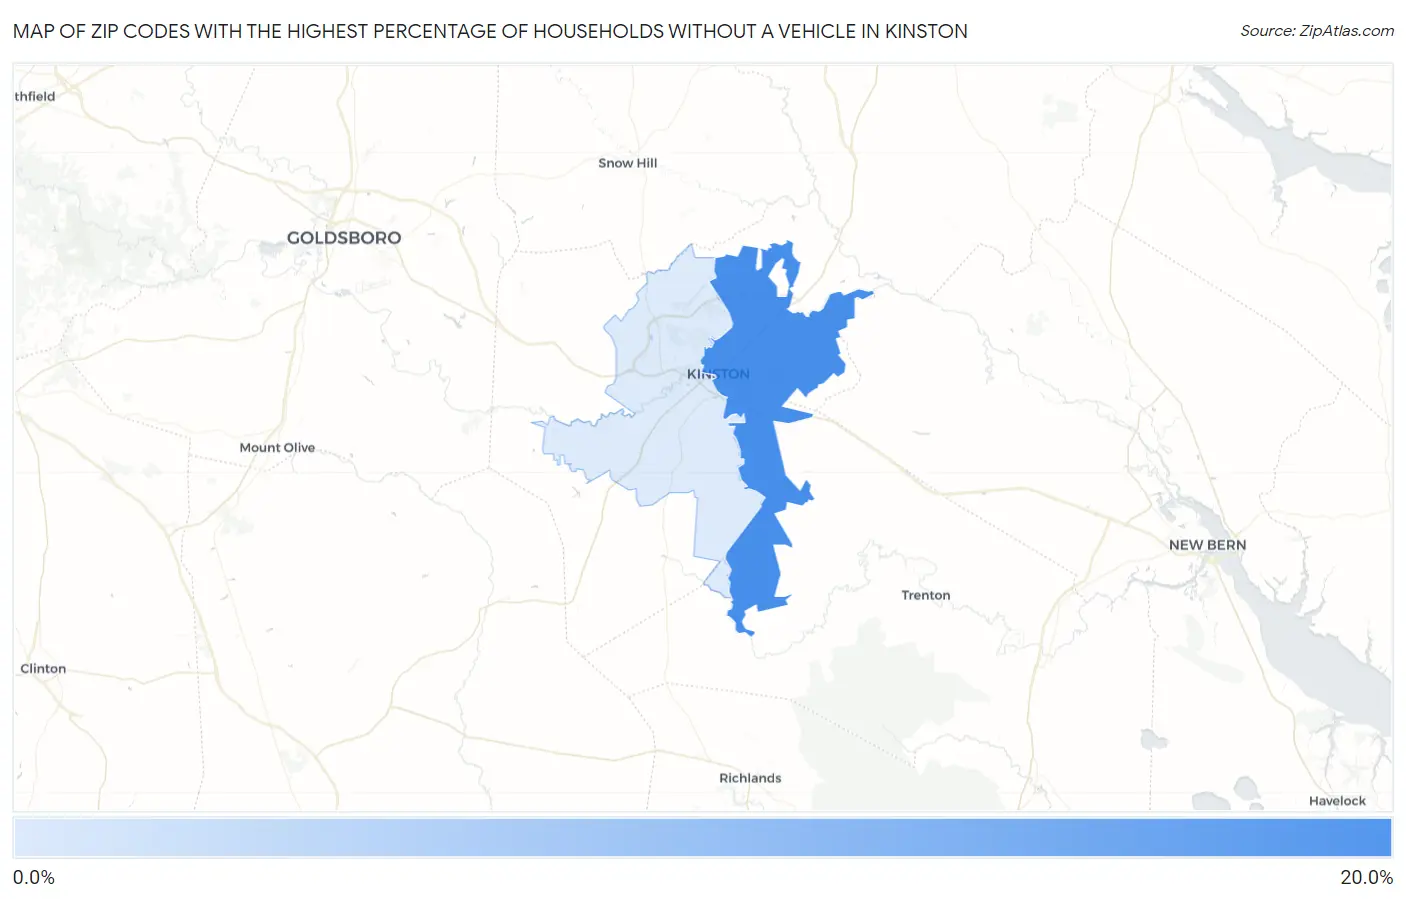
Map of Zip Codes with the Highest Percentage of Households Without a Vehicle in Kinston
0.0%
20.0%
Zip Codes with the Highest Percentage of Households Without a Vehicle in Kinston, NC
| Zip Code | Housholds Without a Car | vs State | vs National | |
| 1. | 28501 | 16.7% | 5.4%(+11.3)#21 | 8.3%(+8.40)#2,010 |
| 2. | 28504 | 5.7% | 5.4%(+0.300)#279 | 8.3%(-2.60)#11,155 |
1
Common Questions
What are the Top Zip Codes with the Highest Percentage of Households Without a Vehicle in Kinston, NC?
Top Zip Codes with the Highest Percentage of Households Without a Vehicle in Kinston, NC are:
What zip code has the Highest Percentage of Households Without a Vehicle in Kinston, NC?
28501 has the Highest Percentage of Households Without a Vehicle in Kinston, NC with 16.7%.
What is the Percentage of Households Without a Vehicle in Kinston, NC?
Percentage of Households Without a Vehicle in Kinston is 17.9%.
What is the Percentage of Households Without a Vehicle in North Carolina?
Percentage of Households Without a Vehicle in North Carolina is 5.4%.
What is the Percentage of Households Without a Vehicle in the United States?
Percentage of Households Without a Vehicle in the United States is 8.3%.