Zip Codes with the Lowest Child Poverty Level Among Girls Under the Age of 16 in Charlotte, NC

RELATED REPORTS & OPTIONS

Lowest Poverty | Girls 0-16
Population
Families and Households
Female Fertility
Female Fertility (Unmarried)
Race (Community Size)
Race (Percentage)
Ancestry (Community Size)
AfghanAfricanAlbanianAlsatianAmericanApacheArabArgentineanArmenianAustralianAustrianBahamianBangladeshiBarbadianBelgianBelizeanBhutaneseBlackfeetBolivianBrazilianBritishBritish West IndianBulgarianBurmeseCajunCambodianCanadianCape VerdeanCelticCentral AmericanCentral American IndianCherokeeChickasawChileanChippewaChoctawColombianCosta RicanCreekCroatianCubanCzechCzechoslovakianDanishDominicanDutchEastern EuropeanEcuadorianEgyptianEnglishEthiopianEuropeanFilipinoFinnishFrenchFrench American IndianFrench CanadianGermanGhanaianGreekGuamanian / ChamorroGuatemalanGuyaneseHaitianHonduranHoumaHungarianIcelanderIndian (Asian)IndonesianIranianIraqiIrishIroquoisIsraeliItalianJamaicanJapaneseJordanianKenyanKiowaKoreanLaotianLatvianLebaneseLiberianLithuanianLumbeeMacedonianMalaysianMalteseMexicanMexican American IndianMoroccanNative HawaiianNavajoNew ZealanderNicaraguanNigerianNorthern EuropeanNorwegianOsagePakistaniPalestinianPanamanianParaguayanPennsylvania GermanPeruvianPolishPortuguesePuerto RicanRomanianRussianSalvadoranSamoanScandinavianScotch-IrishScottishSeminoleSenegaleseSerbianSierra LeoneanSiouxSlavicSlovakSloveneSomaliSouth AfricanSouth AmericanSouth American IndianSpaniardSpanishSri LankanSubsaharan AfricanSudaneseSwedishSwissSyrianTaiwaneseThaiTonganTrinidadian and TobagonianTurkishU.S. Virgin IslanderUkrainianUruguayanVenezuelanVietnameseWelshWest IndianYugoslavianZimbabwean
Ancestry (Percentage)
AfghanAfricanAlbanianAlsatianAmericanApacheArabArgentineanArmenianAustralianAustrianBahamianBangladeshiBarbadianBelgianBelizeanBhutaneseBlackfeetBolivianBrazilianBritishBritish West IndianBulgarianBurmeseCajunCambodianCanadianCape VerdeanCelticCentral AmericanCentral American IndianCherokeeChickasawChileanChippewaChoctawColombianCosta RicanCreekCroatianCubanCzechCzechoslovakianDanishDominicanDutchEastern EuropeanEcuadorianEgyptianEnglishEthiopianEuropeanFilipinoFinnishFrenchFrench American IndianFrench CanadianGermanGhanaianGreekGuamanian / ChamorroGuatemalanGuyaneseHaitianHonduranHoumaHungarianIcelanderIndian (Asian)IndonesianIranianIraqiIrishIroquoisIsraeliItalianJamaicanJapaneseJordanianKenyanKiowaKoreanLaotianLatvianLebaneseLiberianLithuanianLumbeeMacedonianMalaysianMalteseMexicanMexican American IndianMoroccanNative HawaiianNavajoNew ZealanderNicaraguanNigerianNorthern EuropeanNorwegianOsagePakistaniPalestinianPanamanianParaguayanPennsylvania GermanPeruvianPolishPortuguesePuerto RicanRomanianRussianSalvadoranSamoanScandinavianScotch-IrishScottishSeminoleSenegaleseSerbianSierra LeoneanSiouxSlavicSlovakSloveneSomaliSouth AfricanSouth AmericanSouth American IndianSpaniardSpanishSri LankanSubsaharan AfricanSudaneseSwedishSwissSyrianTaiwaneseThaiTonganTrinidadian and TobagonianTurkishU.S. Virgin IslanderUkrainianUruguayanVenezuelanVietnameseWelshWest IndianYugoslavianZimbabwean
Immigrant Origin (Total)
AfghanistanAfricaAlbaniaArgentinaAsiaAustraliaAustriaBahamasBangladeshBarbadosBelarusBelgiumBelizeBoliviaBosnia and HerzegovinaBrazilBulgariaBurma / MyanmarCabo VerdeCambodiaCameroonCanadaCaribbeanCentral AmericaChileChinaColombiaCongoCosta RicaCroatiaCubaCzechoslovakiaDenmarkDominican RepublicEastern AfricaEastern AsiaEastern EuropeEcuadorEgyptEl SalvadorEnglandEritreaEthiopiaEuropeFranceGermanyGhanaGreeceGrenadaGuatemalaGuyanaHaitiHondurasHong KongHungaryIndiaIndonesiaIranIraqIrelandIsraelItalyJamaicaJapanJordanKazakhstanKenyaKoreaKuwaitLaosLatin AmericaLatviaLebanonLiberiaLithuaniaMalaysiaMexicoMiddle AfricaMoldovaMoroccoNepalNetherlandsNicaraguaNigeriaNorthern AfricaNorthern EuropeNorwayOceaniaPakistanPanamaPeruPhilippinesPolandPortugalRomaniaRussiaSaudi ArabiaScotlandSenegalSerbiaSierra LeoneSingaporeSomaliaSouth AfricaSouth AmericaSouth Central AsiaSouth Eastern AsiaSouthern EuropeSpainSri LankaSudanSwedenSwitzerlandSyriaTaiwanThailandTrinidad and TobagoTurkeyUkraineUruguayUzbekistanVenezuelaVietnamWest IndiesWestern AfricaWestern AsiaWestern EuropeZaireZimbabwe
Immigrant Origin (Percentage)
AfghanistanAfricaAlbaniaArgentinaAsiaAustraliaAustriaBahamasBangladeshBarbadosBelarusBelgiumBelizeBoliviaBosnia and HerzegovinaBrazilBulgariaBurma / MyanmarCabo VerdeCambodiaCameroonCanadaCaribbeanCentral AmericaChileChinaColombiaCongoCosta RicaCroatiaCubaCzechoslovakiaDenmarkDominican RepublicEastern AfricaEastern AsiaEastern EuropeEcuadorEgyptEl SalvadorEnglandEritreaEthiopiaEuropeFranceGermanyGhanaGreeceGrenadaGuatemalaGuyanaHaitiHondurasHong KongHungaryIndiaIndonesiaIranIraqIrelandIsraelItalyJamaicaJapanJordanKazakhstanKenyaKoreaKuwaitLaosLatin AmericaLatviaLebanonLiberiaLithuaniaMalaysiaMexicoMiddle AfricaMoldovaMoroccoNepalNetherlandsNicaraguaNigeriaNorthern AfricaNorthern EuropeNorwayOceaniaPakistanPanamaPeruPhilippinesPolandPortugalRomaniaRussiaSaudi ArabiaScotlandSenegalSerbiaSierra LeoneSingaporeSomaliaSouth AfricaSouth AmericaSouth Central AsiaSouth Eastern AsiaSouthern EuropeSpainSri LankaSudanSwedenSwitzerlandSyriaTaiwanThailandTrinidad and TobagoTurkeyUkraineUruguayUzbekistanVenezuelaVietnamWest IndiesWestern AfricaWestern AsiaWestern EuropeZaireZimbabwe
Income
Income (Families)
Income (Households)
Poverty
Poverty (Families)
Unemployment
Employment Occupations
Employment Industries
Employer Class
Commute Time
Commute Means
School Enrollment
Education by Degree Field
Occupancy
Finances
Physical Characteristics
Charlotte
Compare Zip Codes
Comparison Subject

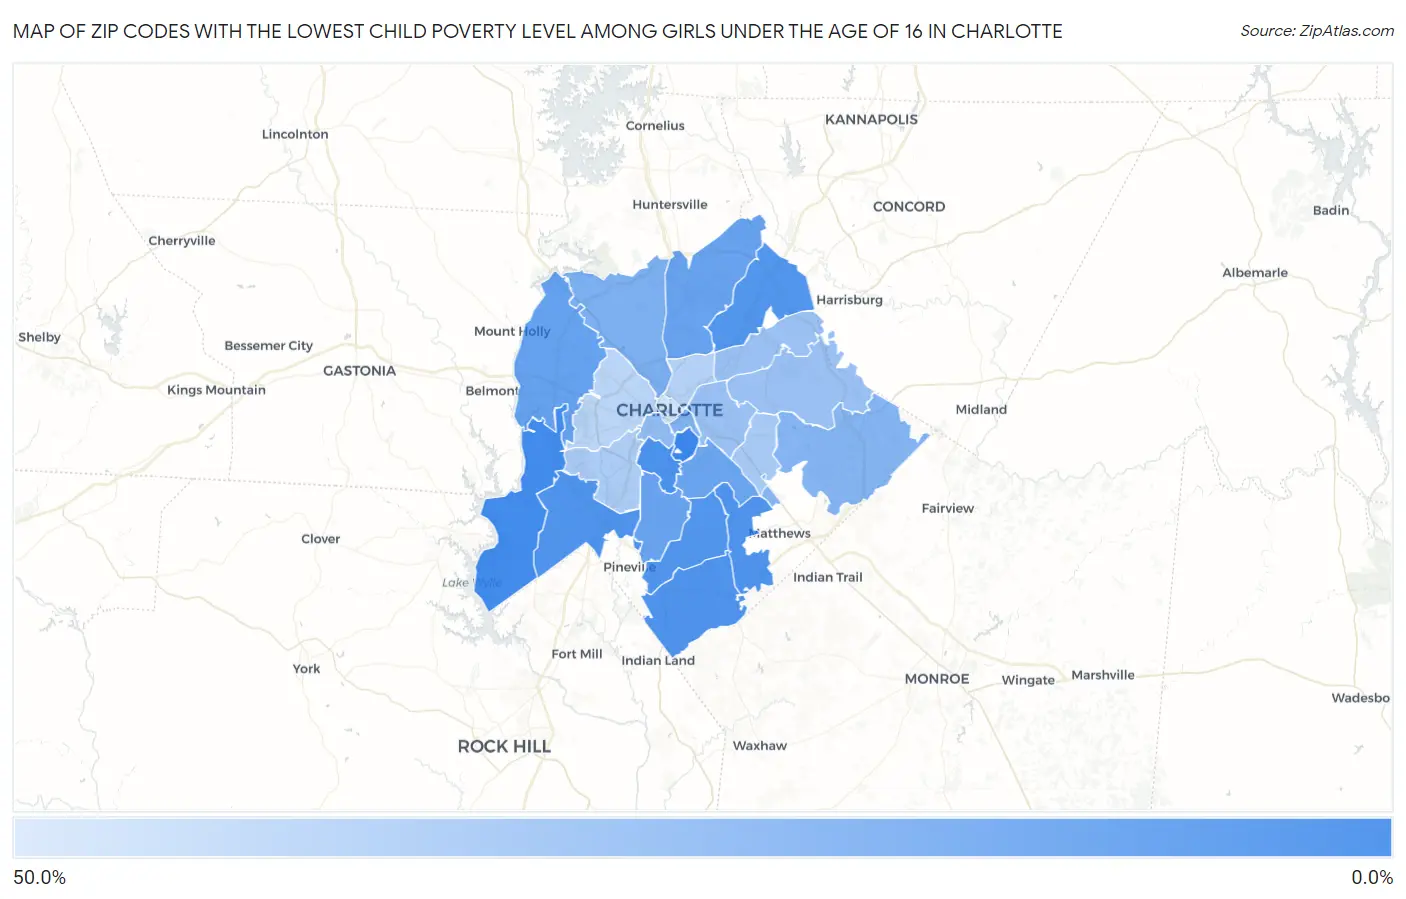
Map of Zip Codes with the Lowest Child Poverty Level Among Girls Under the Age of 16 in Charlotte

50.0%
0.0%
Zip Codes with the Lowest Child Poverty Level Among Girls Under the Age of 16 in Charlotte Map

Zip Codes with the Lowest Child Poverty Level Among Girls Under the Age of 16 in Charlotte, NC

Zip Code Child Poverty (Girls) vs State vs National
1.282071.6%19.2%(-17.6)#817.0%(-15.4)#740
2.282783.4%19.2%(-15.8)#3217.0%(-13.6)#2,224
3.282095.4%19.2%(-13.8)#6917.0%(-11.6)#4,048
4.282705.8%19.2%(-13.4)#7717.0%(-11.2)#4,371
5.282776.0%19.2%(-13.2)#8017.0%(-10.9)#4,599
6.282736.7%19.2%(-12.5)#8917.0%(-10.3)#5,161
7.282627.2%19.2%(-11.9)#10217.0%(-9.73)#5,597
8.282267.4%19.2%(-11.8)#10817.0%(-9.56)#5,746
9.2821411.9%19.2%(-7.34)#19117.0%(-5.12)#9,224
10.2826912.2%19.2%(-7.02)#19517.0%(-4.80)#9,441
11.2821013.3%19.2%(-5.90)#21017.0%(-3.68)#10,208
12.2821113.5%19.2%(-5.72)#21617.0%(-3.50)#10,323
13.2821618.2%19.2%(-1.00)#31217.0%(+1.22)#13,280
14.2820418.9%19.2%(-0.275)#32817.0%(+1.94)#13,712
15.2822720.2%19.2%(+1.00)#34617.0%(+3.22)#14,357
16.2820323.7%19.2%(+4.53)#39317.0%(+6.74)#16,051
17.2820526.1%19.2%(+6.95)#42817.0%(+9.17)#17,046
18.2821326.1%19.2%(+6.96)#42917.0%(+9.17)#17,047
19.2821526.4%19.2%(+7.26)#43217.0%(+9.47)#17,162
20.2821230.2%19.2%(+11.0)#47017.0%(+13.2)#18,407
21.2821731.8%19.2%(+12.6)#48717.0%(+14.8)#18,874
22.2820634.3%19.2%(+15.1)#51017.0%(+17.3)#19,560
23.2820836.2%19.2%(+17.0)#52017.0%(+19.2)#20,007
24.2820243.6%19.2%(+24.4)#56517.0%(+26.6)#21,310

Common Questions

What are the Top 10 Zip Codes with the Lowest Child Poverty Level Among Girls Under the Age of 16 in Charlotte, NC?
Top 10 Zip Codes with the Lowest Child Poverty Level Among Girls Under the Age of 16 in Charlotte, NC are:
#1
1.6%
#2
3.4%
#3
5.4%
#4
5.8%
#5
6.0%
#6
6.7%
#7
7.2%
#8
7.4%
#9
11.9%
#10
12.2%
What zip code has the Lowest Child Poverty Level Among Girls Under the Age of 16 in Charlotte, NC?
28207 has the Lowest Child Poverty Level Among Girls Under the Age of 16 in Charlotte, NC with 1.6%.
What is the Poverty Level Among Girls Under the Age of 16 in Charlotte, NC?
Poverty Level Among Girls Under the Age of 16 in Charlotte is 17.4%.
What is the Poverty Level Among Girls Under the Age of 16 in North Carolina?
Poverty Level Among Girls Under the Age of 16 in North Carolina is 19.2%.
What is the Poverty Level Among Girls Under the Age of 16 in the United States?
Poverty Level Among Girls Under the Age of 16 in the United States is 17.0%.