Zip Codes with the Highest Percentage of Scotch-Irish Population in Charlotte, NC

RELATED REPORTS & OPTIONS

Scotch-Irish
Population
Families and Households
Female Fertility
Female Fertility (Unmarried)
Race (Community Size)
Race (Percentage)
Ancestry (Community Size)
AfghanAfricanAlbanianAlsatianAmericanApacheArabArgentineanArmenianAustralianAustrianBahamianBangladeshiBarbadianBelgianBelizeanBhutaneseBlackfeetBolivianBrazilianBritishBritish West IndianBulgarianBurmeseCajunCambodianCanadianCape VerdeanCelticCentral AmericanCentral American IndianCherokeeChickasawChileanChippewaChoctawColombianCosta RicanCreekCroatianCubanCzechCzechoslovakianDanishDominicanDutchEastern EuropeanEcuadorianEgyptianEnglishEthiopianEuropeanFilipinoFinnishFrenchFrench American IndianFrench CanadianGermanGhanaianGreekGuamanian / ChamorroGuatemalanGuyaneseHaitianHonduranHoumaHungarianIcelanderIndian (Asian)IndonesianIranianIraqiIrishIroquoisIsraeliItalianJamaicanJapaneseJordanianKenyanKiowaKoreanLaotianLatvianLebaneseLiberianLithuanianLumbeeMacedonianMalaysianMalteseMexicanMexican American IndianMoroccanNative HawaiianNavajoNew ZealanderNicaraguanNigerianNorthern EuropeanNorwegianOsagePakistaniPalestinianPanamanianParaguayanPennsylvania GermanPeruvianPolishPortuguesePuerto RicanRomanianRussianSalvadoranSamoanScandinavianScotch-IrishScottishSeminoleSenegaleseSerbianSierra LeoneanSiouxSlavicSlovakSloveneSomaliSouth AfricanSouth AmericanSouth American IndianSpaniardSpanishSri LankanSubsaharan AfricanSudaneseSwedishSwissSyrianTaiwaneseThaiTonganTrinidadian and TobagonianTurkishU.S. Virgin IslanderUkrainianUruguayanVenezuelanVietnameseWelshWest IndianYugoslavianZimbabwean
Ancestry (Percentage)
AfghanAfricanAlbanianAlsatianAmericanApacheArabArgentineanArmenianAustralianAustrianBahamianBangladeshiBarbadianBelgianBelizeanBhutaneseBlackfeetBolivianBrazilianBritishBritish West IndianBulgarianBurmeseCajunCambodianCanadianCape VerdeanCelticCentral AmericanCentral American IndianCherokeeChickasawChileanChippewaChoctawColombianCosta RicanCreekCroatianCubanCzechCzechoslovakianDanishDominicanDutchEastern EuropeanEcuadorianEgyptianEnglishEthiopianEuropeanFilipinoFinnishFrenchFrench American IndianFrench CanadianGermanGhanaianGreekGuamanian / ChamorroGuatemalanGuyaneseHaitianHonduranHoumaHungarianIcelanderIndian (Asian)IndonesianIranianIraqiIrishIroquoisIsraeliItalianJamaicanJapaneseJordanianKenyanKiowaKoreanLaotianLatvianLebaneseLiberianLithuanianLumbeeMacedonianMalaysianMalteseMexicanMexican American IndianMoroccanNative HawaiianNavajoNew ZealanderNicaraguanNigerianNorthern EuropeanNorwegianOsagePakistaniPalestinianPanamanianParaguayanPennsylvania GermanPeruvianPolishPortuguesePuerto RicanRomanianRussianSalvadoranSamoanScandinavianScotch-IrishScottishSeminoleSenegaleseSerbianSierra LeoneanSiouxSlavicSlovakSloveneSomaliSouth AfricanSouth AmericanSouth American IndianSpaniardSpanishSri LankanSubsaharan AfricanSudaneseSwedishSwissSyrianTaiwaneseThaiTonganTrinidadian and TobagonianTurkishU.S. Virgin IslanderUkrainianUruguayanVenezuelanVietnameseWelshWest IndianYugoslavianZimbabwean
Immigrant Origin (Total)
AfghanistanAfricaAlbaniaArgentinaAsiaAustraliaAustriaBahamasBangladeshBarbadosBelarusBelgiumBelizeBoliviaBosnia and HerzegovinaBrazilBulgariaBurma / MyanmarCabo VerdeCambodiaCameroonCanadaCaribbeanCentral AmericaChileChinaColombiaCongoCosta RicaCroatiaCubaCzechoslovakiaDenmarkDominican RepublicEastern AfricaEastern AsiaEastern EuropeEcuadorEgyptEl SalvadorEnglandEritreaEthiopiaEuropeFranceGermanyGhanaGreeceGrenadaGuatemalaGuyanaHaitiHondurasHong KongHungaryIndiaIndonesiaIranIraqIrelandIsraelItalyJamaicaJapanJordanKazakhstanKenyaKoreaKuwaitLaosLatin AmericaLatviaLebanonLiberiaLithuaniaMalaysiaMexicoMiddle AfricaMoldovaMoroccoNepalNetherlandsNicaraguaNigeriaNorthern AfricaNorthern EuropeNorwayOceaniaPakistanPanamaPeruPhilippinesPolandPortugalRomaniaRussiaSaudi ArabiaScotlandSenegalSerbiaSierra LeoneSingaporeSomaliaSouth AfricaSouth AmericaSouth Central AsiaSouth Eastern AsiaSouthern EuropeSpainSri LankaSudanSwedenSwitzerlandSyriaTaiwanThailandTrinidad and TobagoTurkeyUkraineUruguayUzbekistanVenezuelaVietnamWest IndiesWestern AfricaWestern AsiaWestern EuropeZaireZimbabwe
Immigrant Origin (Percentage)
AfghanistanAfricaAlbaniaArgentinaAsiaAustraliaAustriaBahamasBangladeshBarbadosBelarusBelgiumBelizeBoliviaBosnia and HerzegovinaBrazilBulgariaBurma / MyanmarCabo VerdeCambodiaCameroonCanadaCaribbeanCentral AmericaChileChinaColombiaCongoCosta RicaCroatiaCubaCzechoslovakiaDenmarkDominican RepublicEastern AfricaEastern AsiaEastern EuropeEcuadorEgyptEl SalvadorEnglandEritreaEthiopiaEuropeFranceGermanyGhanaGreeceGrenadaGuatemalaGuyanaHaitiHondurasHong KongHungaryIndiaIndonesiaIranIraqIrelandIsraelItalyJamaicaJapanJordanKazakhstanKenyaKoreaKuwaitLaosLatin AmericaLatviaLebanonLiberiaLithuaniaMalaysiaMexicoMiddle AfricaMoldovaMoroccoNepalNetherlandsNicaraguaNigeriaNorthern AfricaNorthern EuropeNorwayOceaniaPakistanPanamaPeruPhilippinesPolandPortugalRomaniaRussiaSaudi ArabiaScotlandSenegalSerbiaSierra LeoneSingaporeSomaliaSouth AfricaSouth AmericaSouth Central AsiaSouth Eastern AsiaSouthern EuropeSpainSri LankaSudanSwedenSwitzerlandSyriaTaiwanThailandTrinidad and TobagoTurkeyUkraineUruguayUzbekistanVenezuelaVietnamWest IndiesWestern AfricaWestern AsiaWestern EuropeZaireZimbabwe
Income
Income (Families)
Income (Households)
Poverty
Poverty (Families)
Unemployment
Employment Occupations
Employment Industries
Employer Class
Commute Time
Commute Means
School Enrollment
Education by Degree Field
Occupancy
Finances
Physical Characteristics
Charlotte
Compare Zip Codes
Comparison Subject

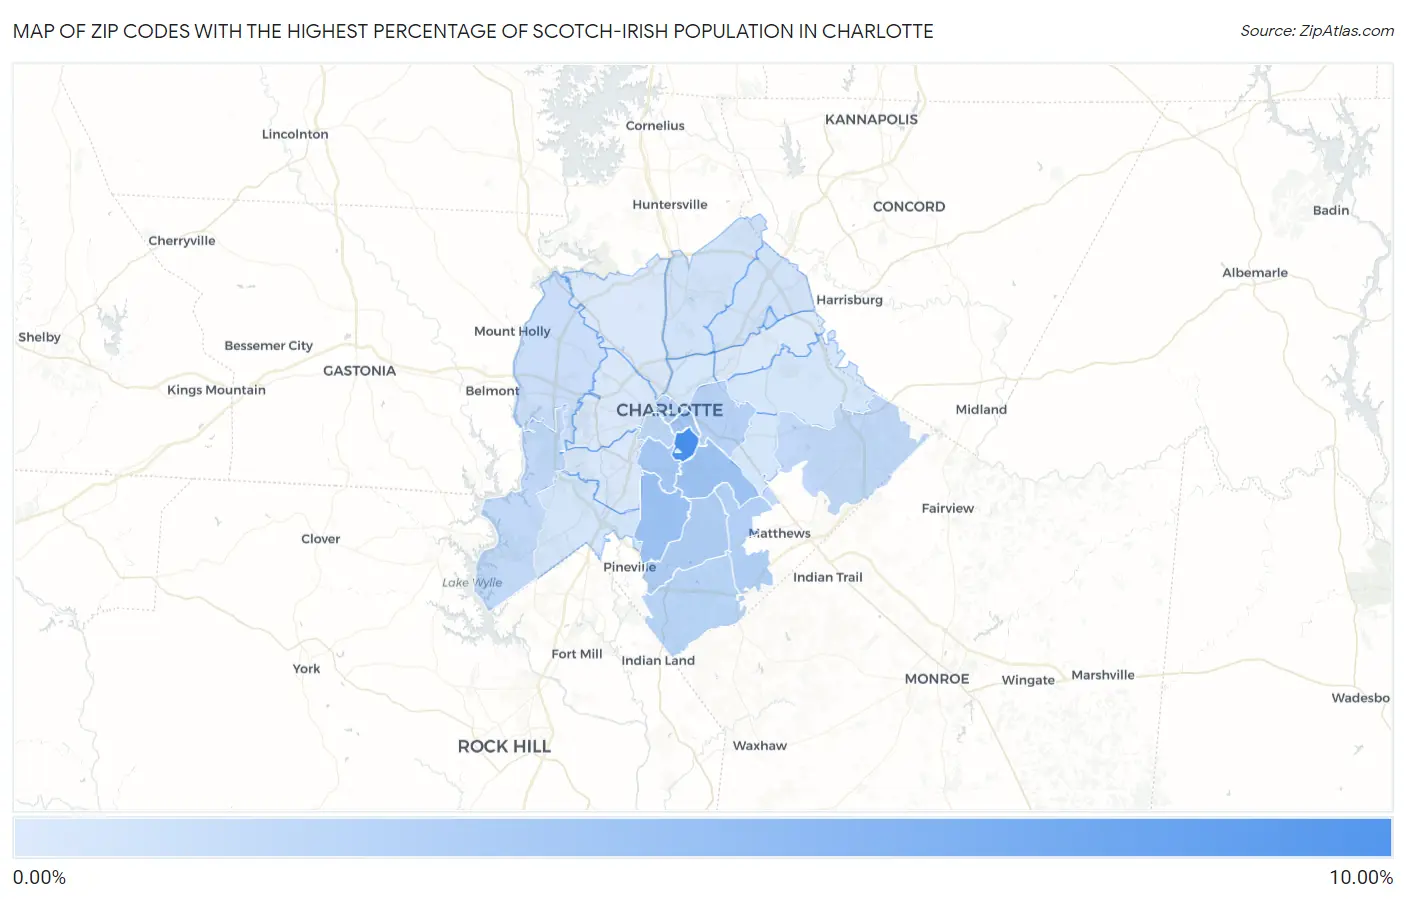
Map of Zip Codes with the Highest Percentage of Scotch-Irish Population in Charlotte

0.00%
10.00%
Zip Codes with the Highest Percentage of Scotch-Irish Population in Charlotte Map

Zip Codes with the Highest Percentage of Scotch-Irish Population in Charlotte, NC

Zip Code Scotch-Irish vs State vs National
1.282078.94%2.04%(+6.90)#190.82%(+8.12)#272
2.282104.04%2.04%(+1.99)#940.82%(+3.22)#1,115
3.282113.89%2.04%(+1.85)#1020.82%(+3.07)#1,188
4.282043.57%2.04%(+1.53)#1250.82%(+2.75)#1,398
5.282093.44%2.04%(+1.39)#1360.82%(+2.62)#1,488
6.282262.99%2.04%(+0.946)#1820.82%(+2.17)#1,974
7.282702.71%2.04%(+0.668)#2140.82%(+1.89)#2,318
8.282022.43%2.04%(+0.385)#2530.82%(+1.61)#2,789
9.282052.41%2.04%(+0.366)#2570.82%(+1.59)#2,821
10.282772.32%2.04%(+0.277)#2770.82%(+1.50)#2,998
11.282032.15%2.04%(+0.103)#3040.82%(+1.33)#3,399
12.282271.89%2.04%(-0.153)#3490.82%(+1.07)#4,201
13.282781.85%2.04%(-0.191)#3620.82%(+1.03)#4,327
14.282231.53%2.04%(-0.517)#4300.82%(+0.708)#5,788
15.282141.37%2.04%(-0.673)#4590.82%(+0.551)#6,724
16.282621.03%2.04%(-1.01)#5360.82%(+0.216)#9,393
17.282690.94%2.04%(-1.10)#5520.82%(+0.127)#10,329
18.282730.91%2.04%(-1.13)#5560.82%(+0.095)#10,679
19.282120.80%2.04%(-1.24)#5730.82%(-0.019)#12,088
20.282150.80%2.04%(-1.25)#5740.82%(-0.022)#12,122
21.282060.73%2.04%(-1.31)#5900.82%(-0.089)#13,006
22.282170.52%2.04%(-1.53)#6340.82%(-0.301)#16,155
23.282160.48%2.04%(-1.57)#6430.82%(-0.342)#16,807
24.282740.46%2.04%(-1.59)#6450.82%(-0.361)#17,124
25.282080.44%2.04%(-1.60)#6490.82%(-0.378)#17,384
26.282130.36%2.04%(-1.68)#6630.82%(-0.456)#18,694

Common Questions

What are the Top 10 Zip Codes with the Highest Percentage of Scotch-Irish Population in Charlotte, NC?
Top 10 Zip Codes with the Highest Percentage of Scotch-Irish Population in Charlotte, NC are:
#1
8.94%
#2
4.04%
#3
3.89%
#4
3.57%
#5
3.44%
#6
2.99%
#7
2.71%
#8
2.43%
#9
2.41%
#10
2.32%
What zip code has the Highest Percentage of Scotch-Irish Population in Charlotte, NC?
28207 has the Highest Percentage of Scotch-Irish Population in Charlotte, NC with 8.94%.
What is the Percentage of Scotch-Irish Population in Charlotte, NC?
Percentage of Scotch-Irish Population in Charlotte is 1.74%.
What is the Percentage of Scotch-Irish Population in North Carolina?
Percentage of Scotch-Irish Population in North Carolina is 2.04%.
What is the Percentage of Scotch-Irish Population in the United States?
Percentage of Scotch-Irish Population in the United States is 0.82%.