Zip Codes with the Highest Percentage of Population Employed in Architecture & Engineering in Missoula, MT
RELATED REPORTS & OPTIONS
Architecture & Engineering
Missoula
Compare Zip Codes
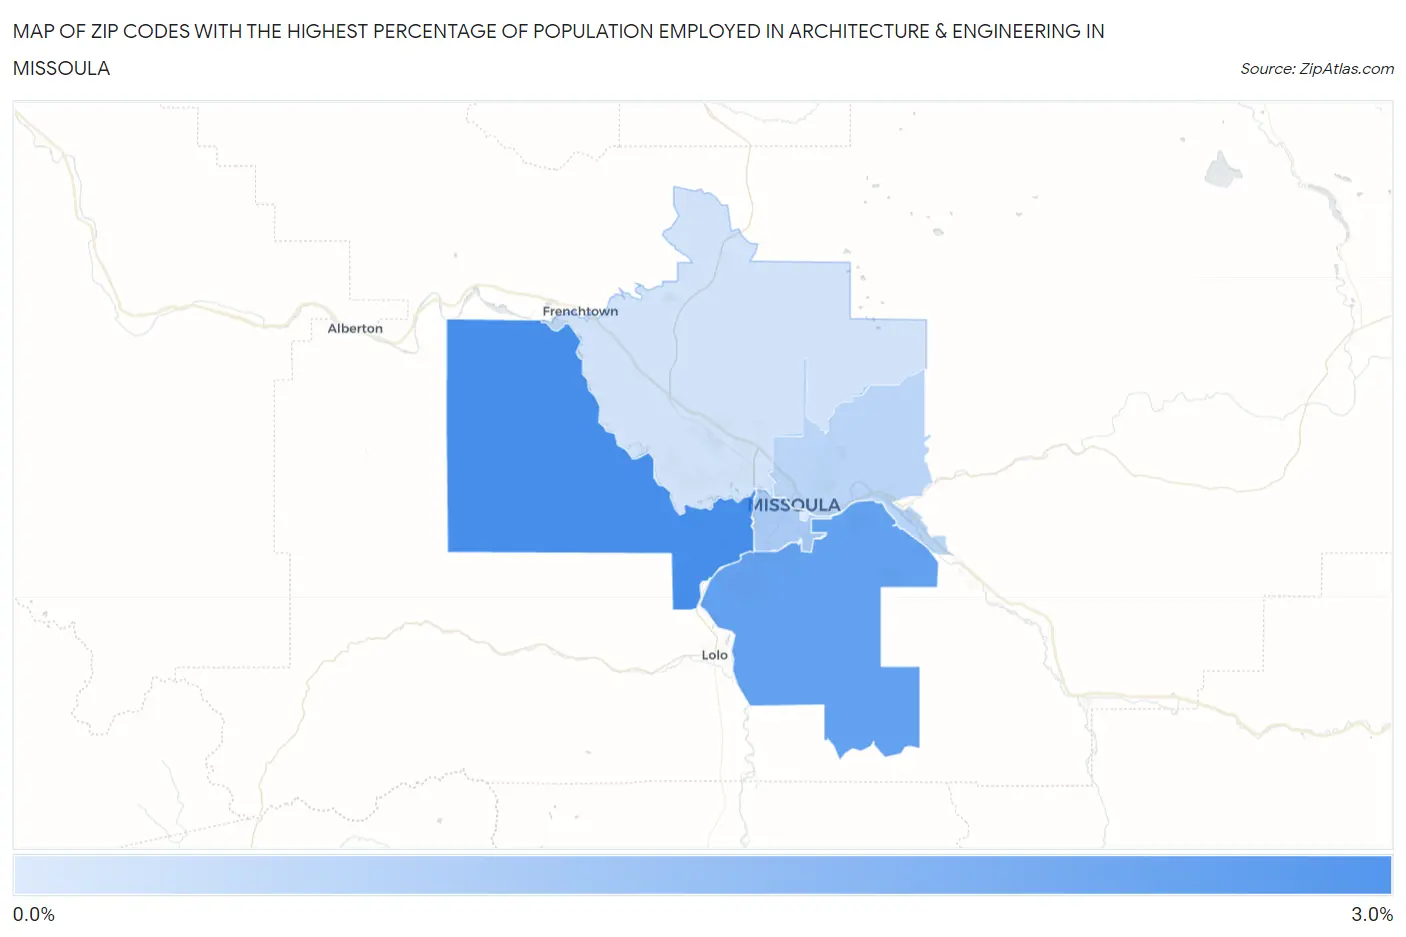
Map of Zip Codes with the Highest Percentage of Population Employed in Architecture & Engineering in Missoula
0.0%
3.0%
Zip Codes with the Highest Percentage of Population Employed in Architecture & Engineering in Missoula, MT
| Zip Code | % Employed | vs State | vs National | |
| 1. | 59804 | 2.8% | 1.8%(+1.03)#38 | 2.1%(+0.639)#5,828 |
| 2. | 59803 | 2.4% | 1.8%(+0.627)#43 | 2.1%(+0.232)#7,561 |
| 3. | 59801 | 1.3% | 1.8%(-0.435)#89 | 2.1%(-0.830)#14,190 |
| 4. | 59802 | 1.1% | 1.8%(-0.691)#101 | 2.1%(-1.09)#16,153 |
| 5. | 59808 | 0.73% | 1.8%(-1.03)#128 | 2.1%(-1.42)#18,715 |
| 6. | 59812 | 0.57% | 1.8%(-1.18)#137 | 2.1%(-1.58)#19,825 |
1
Common Questions
What are the Top 5 Zip Codes with the Highest Percentage of Population Employed in Architecture & Engineering in Missoula, MT?
Top 5 Zip Codes with the Highest Percentage of Population Employed in Architecture & Engineering in Missoula, MT are:
What zip code has the Highest Percentage of Population Employed in Architecture & Engineering in Missoula, MT?
59804 has the Highest Percentage of Population Employed in Architecture & Engineering in Missoula, MT with 2.8%.
What is the Percentage of Population Employed in Architecture & Engineering in Missoula, MT?
Percentage of Population Employed in Architecture & Engineering in Missoula is 1.4%.
What is the Percentage of Population Employed in Architecture & Engineering in Montana?
Percentage of Population Employed in Architecture & Engineering in Montana is 1.8%.
What is the Percentage of Population Employed in Architecture & Engineering in the United States?
Percentage of Population Employed in Architecture & Engineering in the United States is 2.1%.