Zip Codes with the Highest Percentage of Population Employed in Security & Protection in Missoula, MT
RELATED REPORTS & OPTIONS
Security & Protection
Missoula
Compare Zip Codes
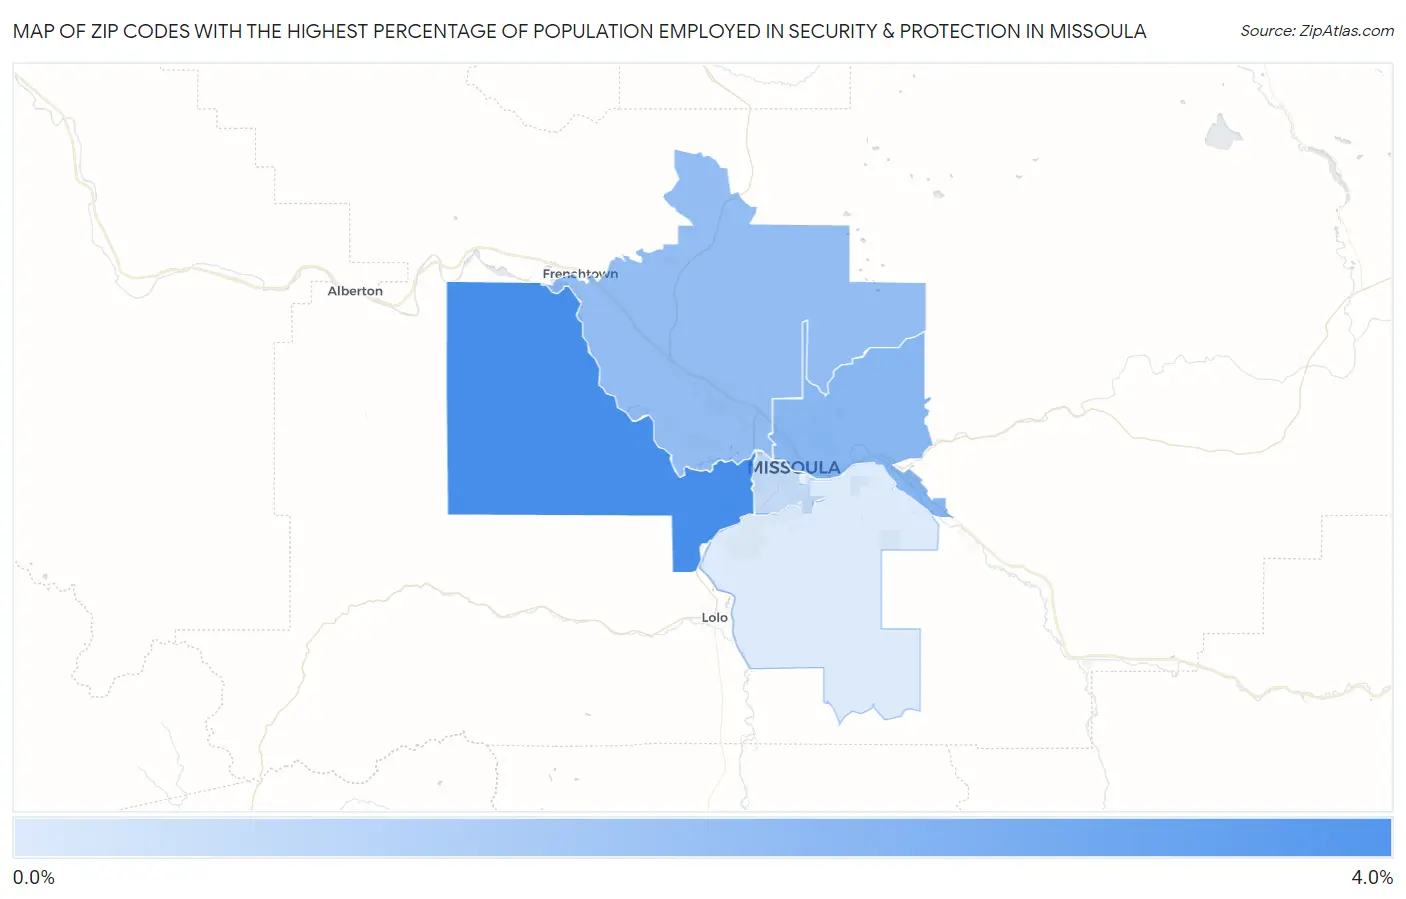
Map of Zip Codes with the Highest Percentage of Population Employed in Security & Protection in Missoula
0.0%
4.0%
Zip Codes with the Highest Percentage of Population Employed in Security & Protection in Missoula, MT
| Zip Code | % Employed | vs State | vs National | |
| 1. | 59804 | 3.2% | 1.9%(+1.24)#70 | 2.1%(+1.00)#6,689 |
| 2. | 59802 | 2.1% | 1.9%(+0.173)#100 | 2.1%(-0.066)#12,036 |
| 3. | 59808 | 1.9% | 1.9%(-0.045)#109 | 2.1%(-0.285)#13,477 |
| 4. | 59801 | 1.1% | 1.9%(-0.834)#141 | 2.1%(-1.07)#19,461 |
| 5. | 59803 | 0.67% | 1.9%(-1.24)#165 | 2.1%(-1.48)#22,296 |
1
Common Questions
What are the Top 5 Zip Codes with the Highest Percentage of Population Employed in Security & Protection in Missoula, MT?
Top 5 Zip Codes with the Highest Percentage of Population Employed in Security & Protection in Missoula, MT are:
What zip code has the Highest Percentage of Population Employed in Security & Protection in Missoula, MT?
59804 has the Highest Percentage of Population Employed in Security & Protection in Missoula, MT with 3.2%.
What is the Percentage of Population Employed in Security & Protection in Missoula, MT?
Percentage of Population Employed in Security & Protection in Missoula is 1.4%.
What is the Percentage of Population Employed in Security & Protection in Montana?
Percentage of Population Employed in Security & Protection in Montana is 1.9%.
What is the Percentage of Population Employed in Security & Protection in the United States?
Percentage of Population Employed in Security & Protection in the United States is 2.1%.