Zip Codes with the Highest Percentage of Population Employed in Architecture & Engineering in Helena, MT
RELATED REPORTS & OPTIONS
Architecture & Engineering
Helena
Compare Zip Codes
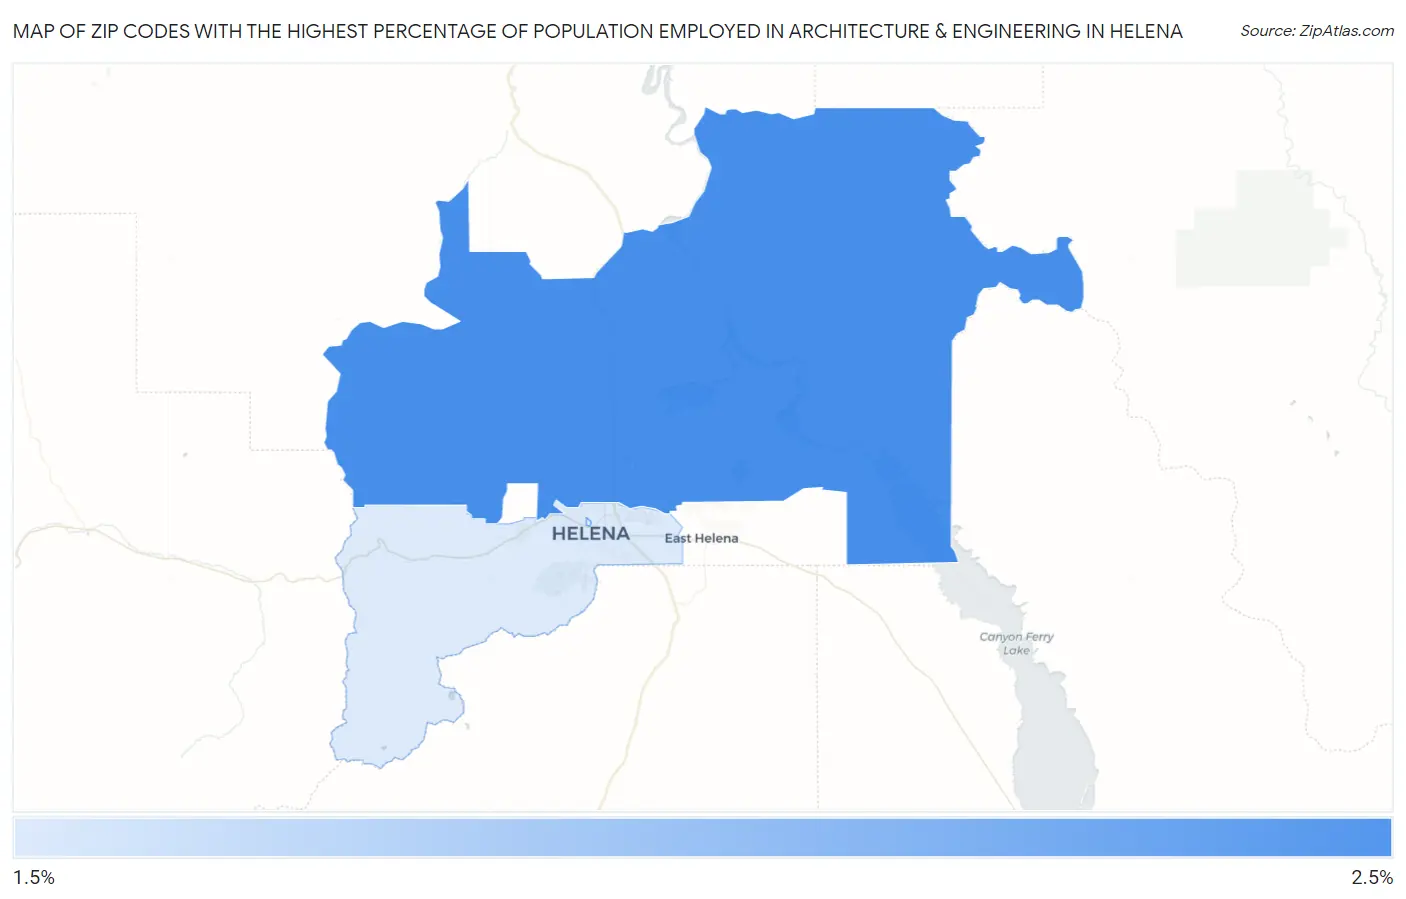
Map of Zip Codes with the Highest Percentage of Population Employed in Architecture & Engineering in Helena
0.0%
2.5%
Zip Codes with the Highest Percentage of Population Employed in Architecture & Engineering in Helena, MT
| Zip Code | % Employed | vs State | vs National | |
| 1. | 59602 | 2.4% | 1.8%(+0.643)#42 | 2.1%(+0.247)#7,489 |
| 2. | 59601 | 2.4% | 1.8%(+0.605)#44 | 2.1%(+0.209)#7,674 |
1
Common Questions
What are the Top Zip Codes with the Highest Percentage of Population Employed in Architecture & Engineering in Helena, MT?
Top Zip Codes with the Highest Percentage of Population Employed in Architecture & Engineering in Helena, MT are:
What zip code has the Highest Percentage of Population Employed in Architecture & Engineering in Helena, MT?
59602 has the Highest Percentage of Population Employed in Architecture & Engineering in Helena, MT with 2.4%.
What is the Percentage of Population Employed in Architecture & Engineering in Helena, MT?
Percentage of Population Employed in Architecture & Engineering in Helena is 2.6%.
What is the Percentage of Population Employed in Architecture & Engineering in Montana?
Percentage of Population Employed in Architecture & Engineering in Montana is 1.8%.
What is the Percentage of Population Employed in Architecture & Engineering in the United States?
Percentage of Population Employed in Architecture & Engineering in the United States is 2.1%.